


Solana (SOLUSD) Is down 1.85% on Jul 5: Why It Happened



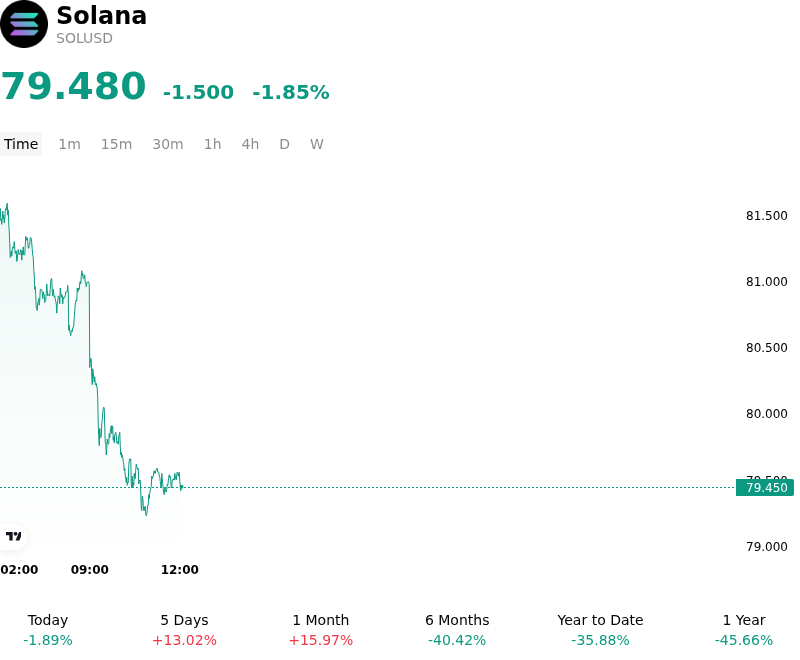
Solana (SOLUSD) is down 1.85% at Jul 5 00:05(ET), now at $79.48, with a 7-day up of 13.67%.
What is driving Solana (SOLUSD)’s stock price down today?
The intraday retreat in Solana reflects a localized cooling period and tactical profit-taking following a sharp relief rally earlier in the week. After successfully defending a critical long-term support floor and staging a double-digit recovery, the asset encountered substantial overhead resistance as it approached the psychologically and technically significant hurdle.
A major headwind contributing to the broader caution is the massive token unlock schedule slate. The market is actively bracing for a major unlock from the ecosystem's leading memecoin launchpad, pump.fun, which is releasing a substantial percentage of its circulating supply. Despite the project's aggressive programmatic buybacks and token burn campaigns aimed at stabilizing supply, the sheer size of the vesting event has introduced localized liquidity-drain anxieties. This has forced some speculative capital to rotate out of ecosystem-linked assets or temporarily reduce risk exposure.
Furthermore, broader institutional sentiment remains highly cautious. While spot Bitcoin and Ethereum markets experienced a temporary macro-driven lift from weaker-than-expected U.S. employment data, which lowered rate hike expectations, the altcoin market continues to suffer from structural capital outflows. Spot Solana ETFs, despite amassing over a billion dollars in cumulative inflows since late 2025, have faced a slowdown in net additions as institutional investors wait for clearer macroeconomic signals. This broader institutional hesitation has left Solana dependent on speculative retail-driven on-chain volumes.
On-chain metrics present a highly divergent outlook. On one hand, Solana’s daily active user base and transaction throughput have hovered near yearly highs, driven by continuous micro-cap activity. On the other hand, transactional fees and total value locked (TVL) remain significantly depressed compared to their cyclical peaks, reflecting a structural shift toward low-value transaction volume.
In the derivatives market, open interest has consolidated. Long positions that chased the rapid bounce toward resistance are finding themselves squeezed as the price consolidates. Looking forward, the near-term structural outlook for Solana relies heavily on whether bulls can absorb the immediate supply unlocks and convert the upcoming Alpenglow consensus upgrade into a sustainable catalyst to clear the formidable overhead moving averages.
Technical Analysis of Solana (SOLUSD)
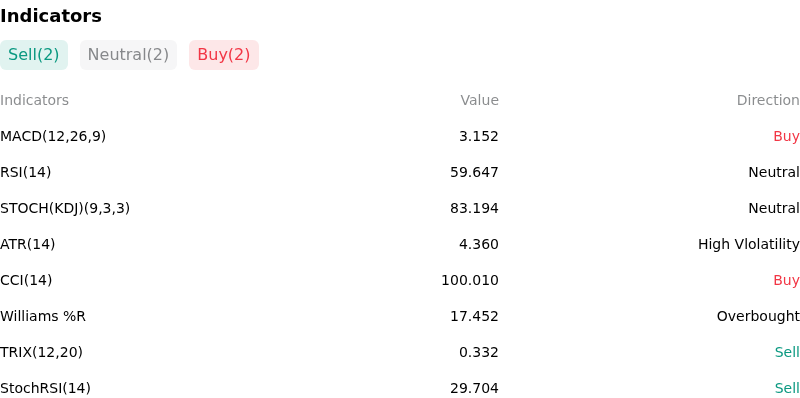
Technically, Solana (SOLUSD) shows a MACD (12,26,9) value of 3.152, indicating a buy signal. The RSI at 59.647 suggests neutral condition and the Williams %R at 17.452 suggests overbought condition. Please monitor closely.
More details about Solana (SOLUSD)
Recent Events and Risks:
- Whale Inflows to Exchanges: Blockchain data tracking shows that approximately 600,000 SOL was suddenly deposited to centralized exchanges in the last 72 hours, signaling elevated near-term selling pressure as large holders potentially position to liquidate.
- Overheated Derivatives and Liquidation Cascades: Leverage is heavily skewed on retail venues, with over 72% of Binance futures accounts holding long positions in SOL; this highly concentrated positioning leaves the market fragile and highly vulnerable to rapid liquidation cascades if the price falls below critical levels.
- Impending Token Unlocks and FTX Liquidation: Ongoing downside risk stems from a major scheduled SOL token unlock set for July 2026, compounded by the constant threat of spot market distribution from the bankrupt FTX estate's remaining assets.
- Major Technical Resistance and Macro Headwinds: Despite a recent network activity surge, the SOL spot price faces robust technical resistance at the $80 to $85 range. Failure to break and consolidate above this zone threatens to push the token back to key support targets near $73 and $63, especially if broader crypto market liquidity continues to feel the pressure of historical ETF outflows.
This article may include AI-generated content that is human-reviewed, which is for reference and general information purposes only and does not constitute investment advice.
Recommended Articles









Comments (0)
Click the $ button, enter the symbol, and select to link a stock, ETF, or other ticker.