

Goldman Sachs Group Inc Stock (GS) Moved Down by 3.36% on Jun 26: What Signal Does It Send?

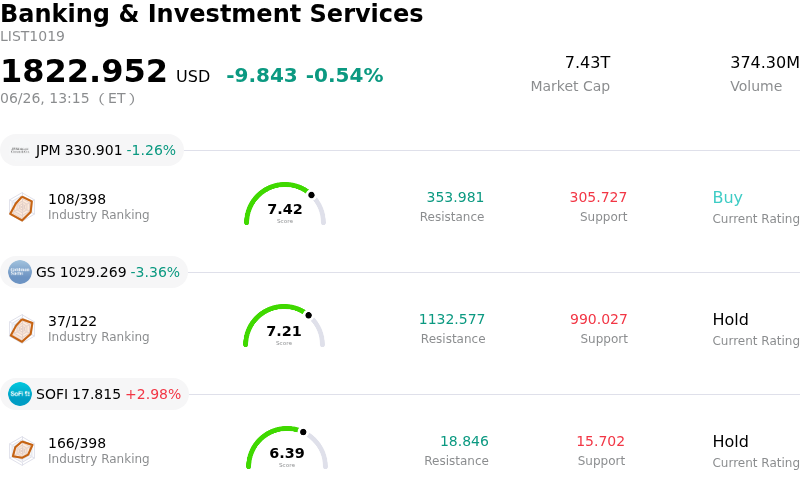
Goldman Sachs Group Inc (GS) moved down by 3.36%. The Banking & Investment Services sector is down by 0.54%. The company underperformed the industry. Top 3 stocks by turnover in the sector: JPMorgan Chase & Co (JPM) down 1.26%; Goldman Sachs Group Inc (GS) down 3.36%; SoFi Technologies Inc (SOFI) up 2.98%.
What is driving Goldman Sachs Group Inc (GS)’s stock price down today?
Goldman Sachs shares experienced notable downward pressure and significant intraday volatility, driven by a combination of dampened dealmaking sentiment, capital return dynamics, and valuation concerns following a prolonged upward run.
A primary catalyst for the decline was reports that a major artificial intelligence firm, OpenAI, is considering postponing its highly anticipated initial public offering until next year. High-profile technology listings are critical drivers of market sentiment and represent lucrative underwriting opportunities for Wall Street’s premier investment banks. A potential delay for such a flagship IPO has introduced caution regarding the broader dealmaking pipeline, dampening near-term advisory and underwriting fee expectations for Goldman Sachs.
Furthermore, capital return announcements following the Federal Reserve’s annual stress tests created a mixed picture. While the banking system demonstrated overall resilience, and Goldman Sachs announced a dividend increase, the capital allocation strategy fell short of some peers. Unlike other financial institutions that authorized massive new stock buyback programs, Goldman Sachs did not introduce a new share repurchase authorization. This omission made its immediate capital return package less competitive, leading some income and value-focused investors to rotate funds toward other major banking institutions.
The stock’s pullback was also exacerbated by valuation pressures. After a strong multi-year rally, the investment bank’s shares have been trading at a premium relative to their long-term historical averages. With the forward price-to-earnings ratio sitting comfortably above its median and lacking the immediate support of a fresh share buyback program, the stock became vulnerable to profit-taking on any signs of macro or industry headwinds. These factors combined to drive the intraday downward volatility.
Technical Analysis of Goldman Sachs Group Inc (GS)
Technically, Goldman Sachs Group Inc (GS) shows a MACD (12,26,9) value of -5.032, indicating a neutral signal. The RSI at 55.791 suggests neutral condition and the Williams %R at 47.943 suggests neutral condition. Please monitor closely.
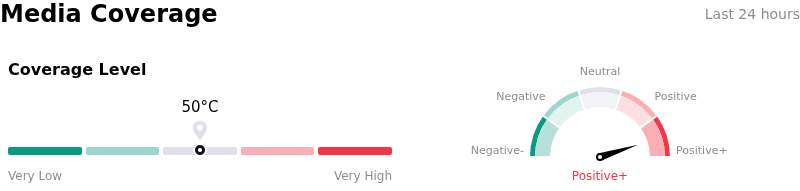
Media Coverage of Goldman Sachs Group Inc (GS)
In terms of media coverage, Goldman Sachs Group Inc (GS) shows a coverage score of 50, indicating a moderate level of media attention. The overall market sentiment index is currently in extremely bullish zone.
Fundamental Analysis of Goldman Sachs Group Inc (GS)
Goldman Sachs Group Inc (GS) is in the Banking & Investment Services industry. Its latest annual revenue is $117.10B, ranking 2 in the industry. The net profit is $16.30B, ranking 1 in the industry. Company Profile
Over the past month, multiple analysts have rated the company as Hold, with an average price target of $985.32, a high of $1195.00, and a low of $765.00.
More details about Goldman Sachs Group Inc (GS)
Company Specific Risks:
- Exposure to Underwriting and Advisory Fee Churn: Reports on June 26, 2026, indicating that OpenAI may postpone its highly anticipated initial public offering until next year triggered immediate intraday volatility, causing Goldman Sachs shares to drop by up to 4.8% due to concerns over deferred investment banking and advisory pipelines.
- Substantial Valuation Premium and Heavy Insider Selling: Market analysis in late June 2026 highlights that the stock is trading roughly 12% to 17% above its consensus fair value, with a trailing P/E ratio of 18.9x—nearly 33% above its 5-year median. This overvaluation risk is further underscored by zero insider buying and $35.6 million in insider share liquidations over the preceding months.
- Structural Leverage and Elevated Trading Revenue Sensitivity: Following the Federal Reserve's CCAR stress test results released on June 24, 2026, analytical reviews flagged that Goldman's underlying financial profile continues to be constrained by weak cash flow and high leverage. The bank's heavy reliance on volatile trading desk revenues leaves its capital base vulnerable to rapid compression if market conditions stabilize or shift to a low-volatility environment.
- Macro-Driven Asset Devaluations and High Cost of Capital: Driven by internal macroeconomic projections showing no Federal Reserve interest rate cuts in 2026, Goldman tactically lowered its year-end gold price forecast from $5,400 to $4,900 on June 25, 2026. This prolonged "higher-for-longer" rate environment increases debt refinancing costs for corporate clients, threatening to decelerate commercial dealmaking and compress advisory margins.
This article may include AI-generated content that is human-reviewed, which is for reference and general information purposes only and does not constitute investment advice.
Recommended Articles


Comments (0)
Click the $ button, enter the symbol, and select to link a stock, ETF, or other ticker.