

Intuit Inc Stock (INTU) Moved Down by 4.35% on May 13: Key Drivers Unveiled

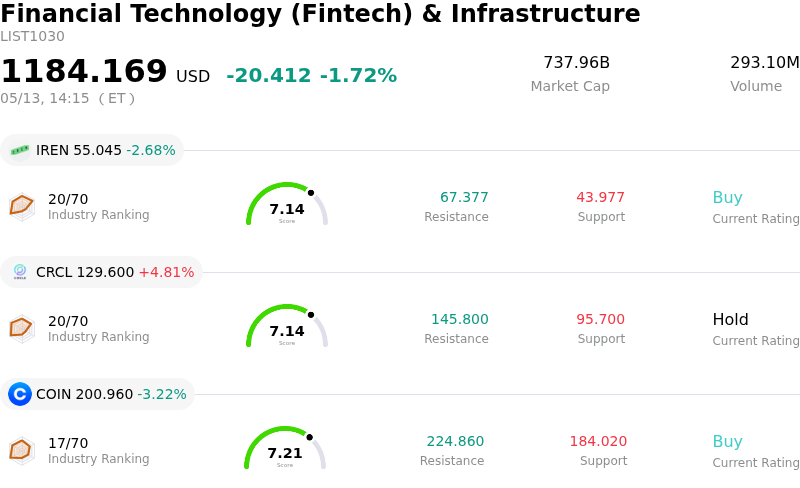
Intuit Inc (INTU) moved down by 4.35%. The Financial Technology (Fintech) & Infrastructure sector is down by 1.72%. The company underperformed the industry. Top 3 stocks by turnover in the sector: IREN Ltd (IREN) down 2.68%; Circle Internet Group Inc (CRCL) up 4.81%; Coinbase Global Inc (COIN) down 3.22%.
What is driving Intuit Inc (INTU)’s stock price down today?
Intuit's stock experienced a notable decline on May 13, 2026, driven by a combination of factors related to upcoming financial disclosures, shifting analyst sentiment, and broader industry concerns.
A primary contributor to the intraday volatility was investor positioning ahead of the company's third-quarter fiscal year 2026 earnings report, scheduled for release after market close on May 20, 2026. Historically, Intuit's stock has shown significant movement around earnings announcements, prompting some investors to reduce their exposure in anticipation of potential fluctuations.
Adding to the cautious sentiment, a recent analyst forecast adjustment also weighed on the stock. On May 11, 2026, TD Cowen maintained its "Buy" rating for Intuit but lowered its price target from $633 to $576. While still a positive rating, the reduction in the price target reinforced a more conservative outlook among investors.
Furthermore, Intuit, like many companies in the software sector, is contending with persistent market concerns regarding the potential disruptive impact of artificial intelligence on traditional Software-as-a-Service business models. This overarching narrative of AI-driven valuation compression in the tech industry has contributed to Intuit's year-to-date performance, and it continued to exert downward pressure on the stock, causing it to underperform broader market indices on the day. Although Intuit announced enhancements to its AI-Native Enterprise Suite on May 13, 2026, focusing on new features for mid-market businesses, this positive product development was not sufficient to counteract the prevailing selling pressure.
Technical Analysis of Intuit Inc (INTU)
Technically, Intuit Inc (INTU) shows a MACD (12,26,9) value of [-5.40], indicating a neutral signal. The RSI at 45.03 suggests neutral condition and the Williams %R at -68.81 suggests oversold condition. Please monitor closely.
Fundamental Analysis of Intuit Inc (INTU)
Intuit Inc (INTU) is in the Financial Technology (Fintech) & Infrastructure industry. Its latest annual revenue is $18.83B, ranking 2 in the industry. The net profit is $3.87B, ranking 1 in the industry. Company Profile
Over the past month, multiple analysts have rated the company as Buy, with an average price target of $597.29, a high of $916.00, and a low of $425.00.
More details about Intuit Inc (INTU)
Company Specific Risks:
- A recent class action lawsuit filed on May 8, 2026, alleges that TurboTax's Refund Advance loans disproportionately harm U.S. service members by charging annual percentage rates in excess of legal caps, creating potential legal and financial liabilities for Intuit.
- Intuit's stock is under significant pressure, having fallen 34% from its highs and trading at a multi-year low earnings multiple, indicating market skepticism and heightened investor expectations ahead of the crucial Q3 earnings report.
- The Credit Karma segment is forecast to experience a notable deceleration in year-over-year growth to just above 10%, representing a sharp decline from the previously reported 23% growth rate and signaling potential headwinds for a key growth driver.
This article may include AI-generated content that is human-reviewed, which is for reference and general information purposes only and does not constitute investment advice.
Recommended Articles


Comments (0)
Click the $ button, enter the symbol, and select to link a stock, ETF, or other ticker.