

Newmont Corporation Stock (NEM) Moved Down by 5.59% on Apr 28: What Investors Need To Know

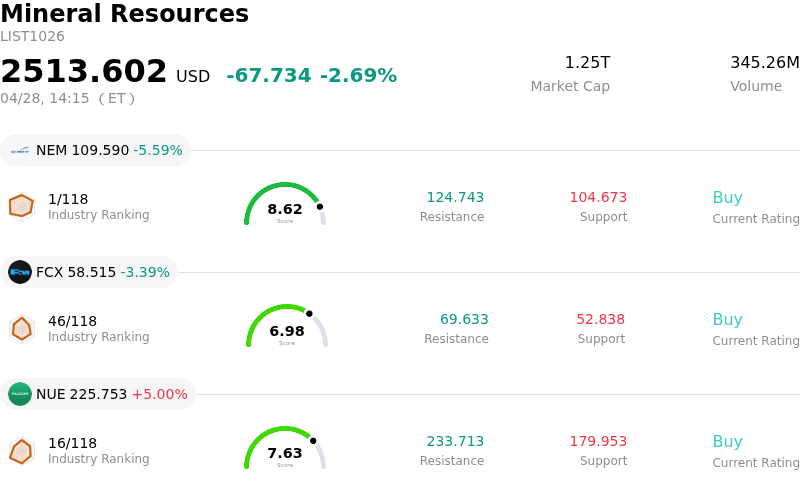
Newmont Corporation (NEM) moved down by 5.59%. The Mineral Resources sector is down by 2.69%. The company underperformed the industry. Top 3 stocks by turnover in the sector: Newmont Corporation (NEM) down 5.59%; Freeport-McMoRan Inc (FCX) down 3.39%; Nucor Corp (NUE) up 5.00%.
What is driving Newmont Corporation (NEM)’s stock price down today?
Newmont's stock experienced downward pressure today, largely driven by a notable decline in gold prices. The precious metal saw a significant fall, reaching its lowest point in several weeks. This downturn in gold is linked to broader macroeconomic concerns, specifically rising oil prices which are fueling inflation worries, and a perceived dampening of sentiment surrounding potential US-Iran negotiations. When gold prices fall, companies like Newmont, a major gold producer, typically see their share prices react negatively due to the direct impact on their revenue expectations.
Despite this market movement, Newmont recently reported robust financial results for the first quarter of 2026, surpassing analyst expectations for both earnings per share and revenue. The company also announced a record-breaking free cash flow and an increased share repurchase authorization. However, even these strong financial indicators were not enough to counteract the broader market forces impacting gold prices and, consequently, the company's stock performance.
Analyst sentiment generally remains positive for Newmont, with many firms maintaining "Buy" ratings and, in some cases, raising price targets following the strong Q1 report, citing favorable cash flow and share buyback activities. Nevertheless, analysts have also highlighted potential risks, including a directive from Ghana for the company to transition to local contractors by late 2026. This regulatory change could lead to increased operating costs and put pressure on returns from a key mining region, contributing to a more cautious outlook among some investors.
Technical Analysis of Newmont Corporation (NEM)
Technically, Newmont Corporation (NEM) shows a MACD (12,26,9) value of [0.65], indicating a buy signal. The RSI at 52.85 suggests neutral condition and the Williams %R at -41.93 suggests oversold condition. Please monitor closely.
Fundamental Analysis of Newmont Corporation (NEM)
Newmont Corporation (NEM) is in the Mineral Resources industry. Its latest annual revenue is $22.67B, ranking 8 in the industry. The net profit is $7.08B, ranking 3 in the industry. Company Profile
Over the past month, multiple analysts have rated the company as Buy, with an average price target of $141.33, a high of $205.00, and a low of $64.32.
More details about Newmont Corporation (NEM)
Company Specific Risks:
- Newmont anticipates lower gold production for the second quarter of 2026 compared to the first quarter, alongside notably higher all-in sustaining costs due to increased sustaining capital expenditures, reduced silver by-product revenue, and structural cost increases at certain mines.
- The Ghanaian government has issued a directive requiring Newmont to transition its mining operations to local firms by December 2026, with potential sanctions for non-compliance, which could negatively impact operational efficiency and profitability.
- A newly enacted royalty and levy regime in Ghana is expected to increase the All-in Sustaining Costs (AISC) for Newmont's Ghanaian operations by approximately $185 per ounce, contributing to an overall company AISC increase of about $25 per ounce.
- There is unresolved uncertainty regarding a notice of default with Newmont's Nevada Gold Mines joint venture partner, presenting a potential legal and operational risk.
This article may include AI-generated content that is human-reviewed, which is for reference and general information purposes only and does not constitute investment advice.
Recommended Articles


Comments (0)
Click the $ button, enter the symbol, and select to link a stock, ETF, or other ticker.