

US Dollar Index Price Analysis: Three Black Crows pattern is bad omen for Dollar
- The US Dollar Index is forming a Three Black Crows bearish Japanese candlestick pattern.
- The price pattern is bearish and, if it completes, it will probably indicate more downside to come.
- Support comes in at swing lows in the 102s and 100s.
The US Dollar Index (DXY) is trading lower at 103.67. It is declining for the third week in a row, after peaking at 106.13 (June highs).
US Dollar Index Weekly Chart
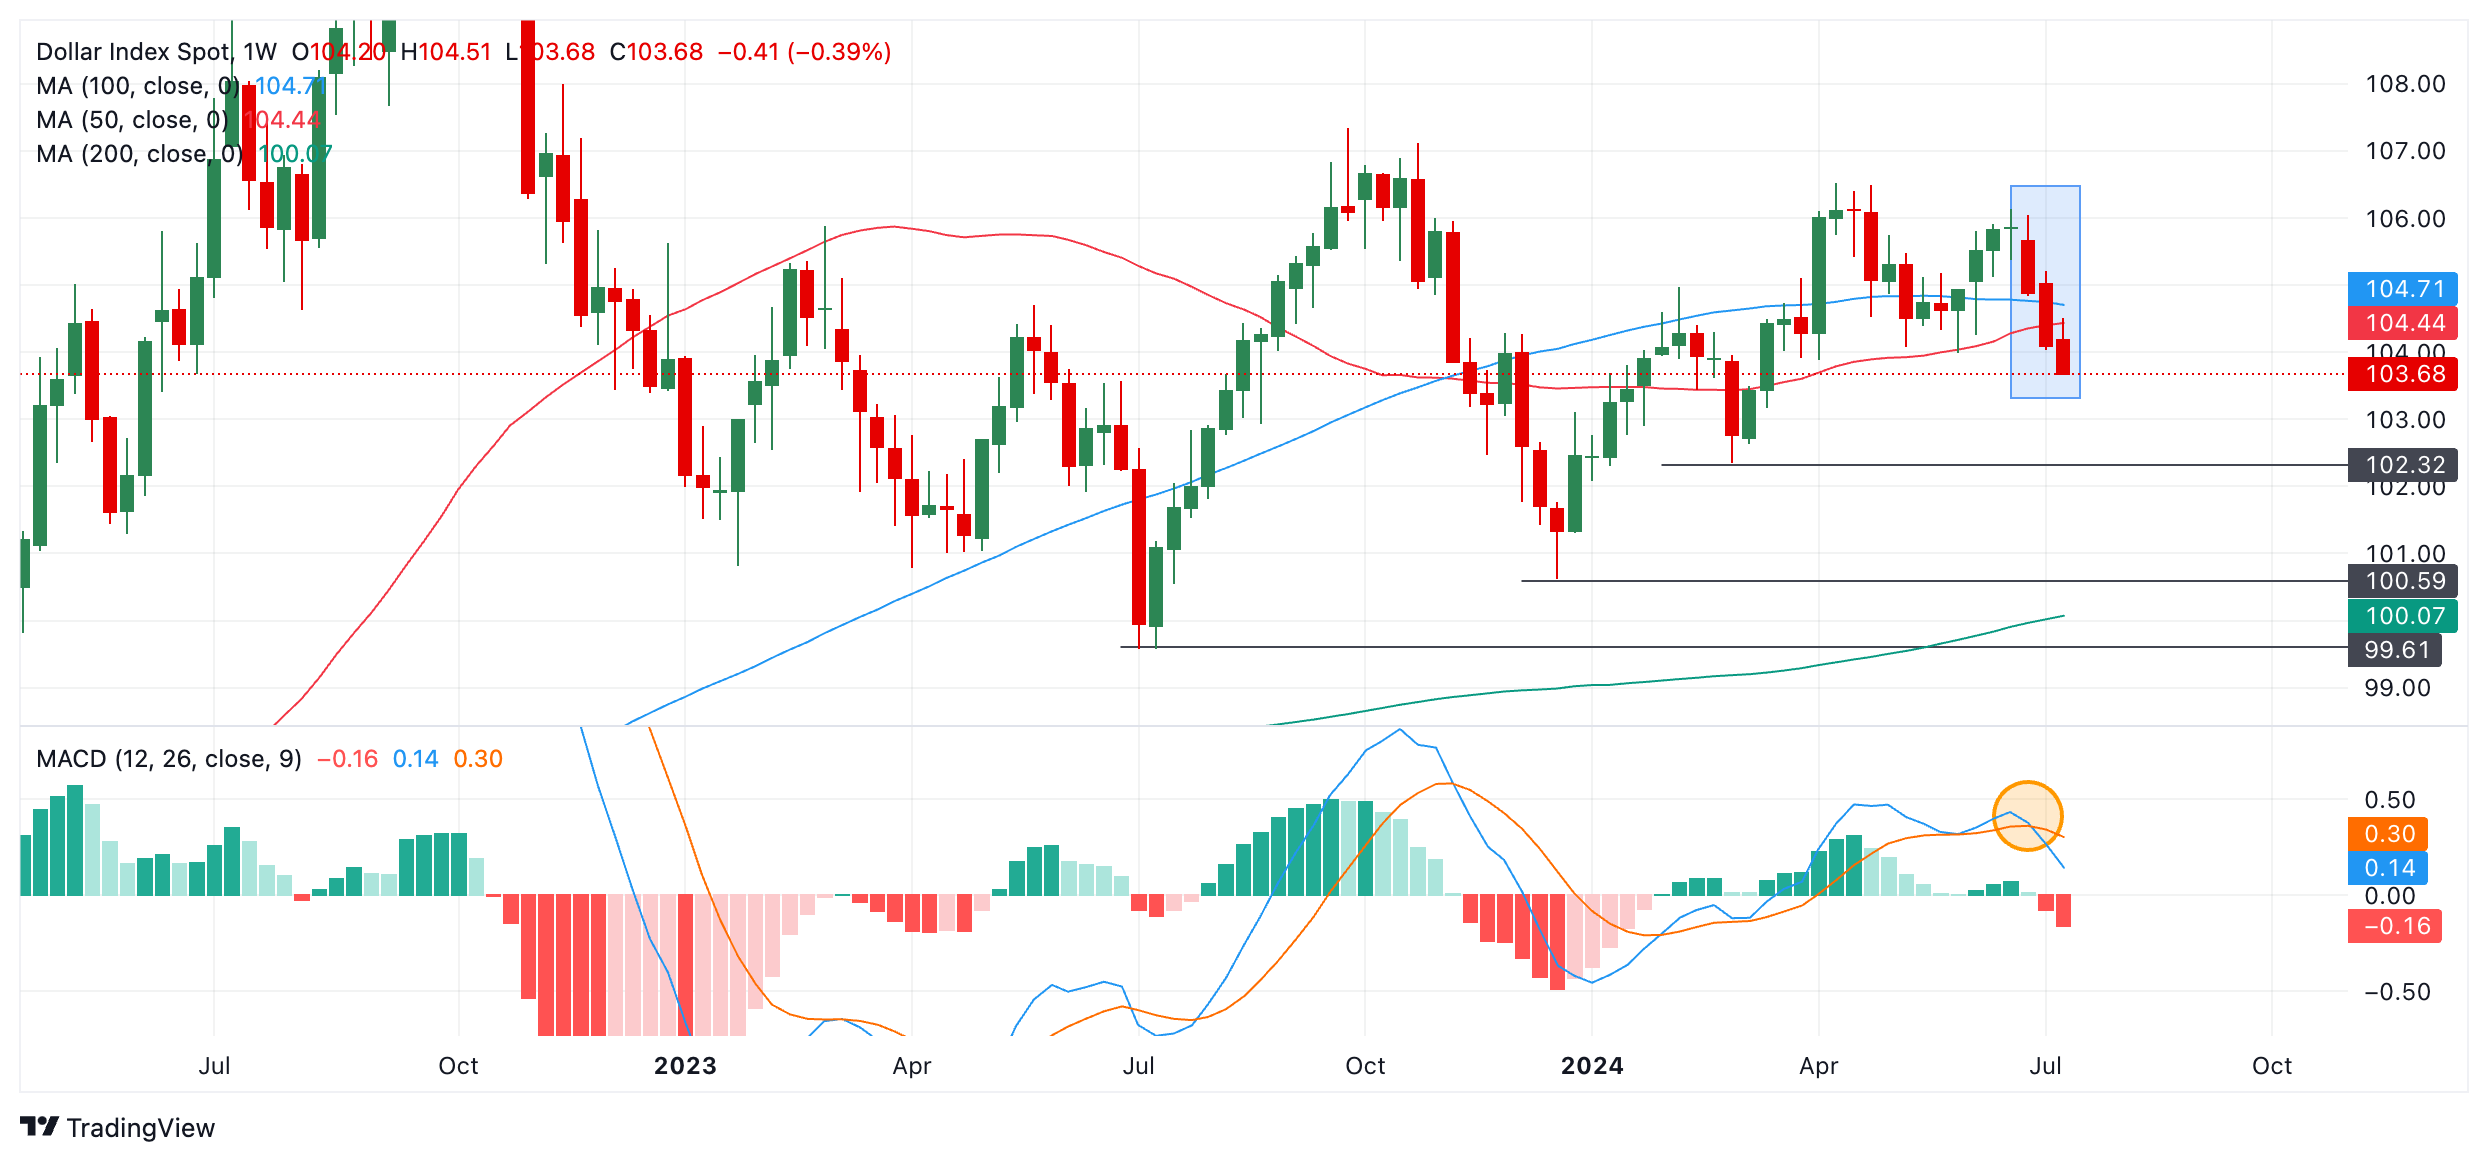
The index might be forming a bearish Three Black Crows Japanese candlestick pattern (shaded blue rectangle), which has bearish connotations. If the current week ends as a bearish red candlestick that will confirm a Three Black Crows has completed and indicate more downside is expected to follow.
Assuming this is the case, the next downside target for the pair is support from the swing low at 102.32, followed by a similar swing low from late 2023 at 100.59.
The bearish view is complemented and reinforced by the bearish crossover of the Moving Average Convergence Divergence (MACD) momentum indicator below its orange signal line (circled).
Recommended Articles


Comments (0)
Click the $ button, enter the symbol, and select to link a stock, ETF, or other ticker.