

USD/INR pulls back from fresh record highs despite Asian weakness

- USD/INR retreats after hitting a fresh all-time high of 92.19 on Wednesday.
- The Indian Rupee may face pressure from dollar demand tied to maturing NDF positions and month-end importer buying.
- The US Dollar could strengthen as Treasury Secretary Bessent reaffirmed the commitment to a strong dollar policy.
USD/INR depreciates after registering more than 0.5% gains in the previous session. The pair touched a fresh all-time high of 92.19 on January 28, driven by broad weakness in Asian currencies as the US Dollar strengthened after US Treasury Secretary Scott Bessent reaffirmed the US commitment to a strong dollar policy. Additionally, the Indian Rupee (INR) could face pressure from dollar demand driven by maturing NDF positions and month-end importer buying.
Reuters quoted a Singapore-based hedge fund portfolio manager as saying he was surprised by the magnitude of the move, noting that markets appear to be pre-empting upcoming NDF maturities and that stop-loss orders may have been triggered. He added that the key question is how the Reserve Bank of India (RBI) will respond if the rupee weakens beyond 92.00, whether it allows the USD/INR pair to reprice higher or intervenes to pull it back.
The Indian Rupee (INR) failed to find support from improved sentiment following the India–EU trade deal, which is expected to lower tariffs on most Indian exports. India has also decided to cut tariffs on EU car imports to 40% from as high as 110%.
Most economists polled by Reuters expect the Reserve Bank of India (RBI) to keep its key policy rate at 5.25% through 2026, as the central bank evaluates the economic impact of previous interest rate cuts.
US Dollar struggles despite reaffirmed commitment to a strong dollar policy
- The US Dollar Index (DXY), which measures the value of the US Dollar against six major currencies, is losing ground after registering over 0.5% gains in the previous session and trading near 96.10 at the time of writing.
- However, the Greenback found support after Treasury Secretary Scott Bessent reaffirmed the US commitment to a “strong dollar policy,” pushing back against earlier comments from US President Donald Trump that suggested tolerance for a weaker currency. Bessent stressed that solid US fundamentals and sound policy settings should continue to draw capital inflows, rejecting speculation of any US intervention to sell dollars against the Japanese Yen (JPY).
- The US Federal Reserve (Fed) decided to keep interest rates unchanged at its January meeting on Wednesday, pointing to still-elevated inflation and resilient economic growth.
- Fed Chair Jerome Powell noted during the post-meeting press conference that job gains have moderated and the unemployment rate has shown signs of stabilization, adding that the Fed is “well positioned” to assess incoming data on a meeting-by-meeting basis and remains off a preset path for future rate decisions.
- Meanwhile, Morgan Stanley analysts said in a note that further policy easing largely hinges on clear evidence of disinflation, which they expect to emerge later in 2026. As a result, they maintain their forecast for rate cuts in June and September.
- US President Donald Trump would soon announce his nominee to replace Fed Chair Jerome Powell, fueling speculation that the next chair could favor faster interest rate cuts.
- Indian Prime Minister Narendra Modi’s government has agreed to immediately cut duties on select vehicles priced above EUR 15,000, with rates set to gradually fall to 10%, easing market access for automakers such as Volkswagen, Mercedes-Benz, and BMW.
- The US could remove the 25% punitive tariffs imposed on India in mid-2025 for purchasing Russian Oil, following comments by US Treasury Secretary Scott Bessent on the sidelines of the World Economic Forum in Davos last week, which fueled speculation about easing trade tensions.
- RBI’s INR 1 lakh crore liquidity infusion via government bond purchases is expected to stabilize funding conditions. With the Union Budget and clarity on US–India trade timelines pending, markets are likely to stay cautious, according to Reuters.
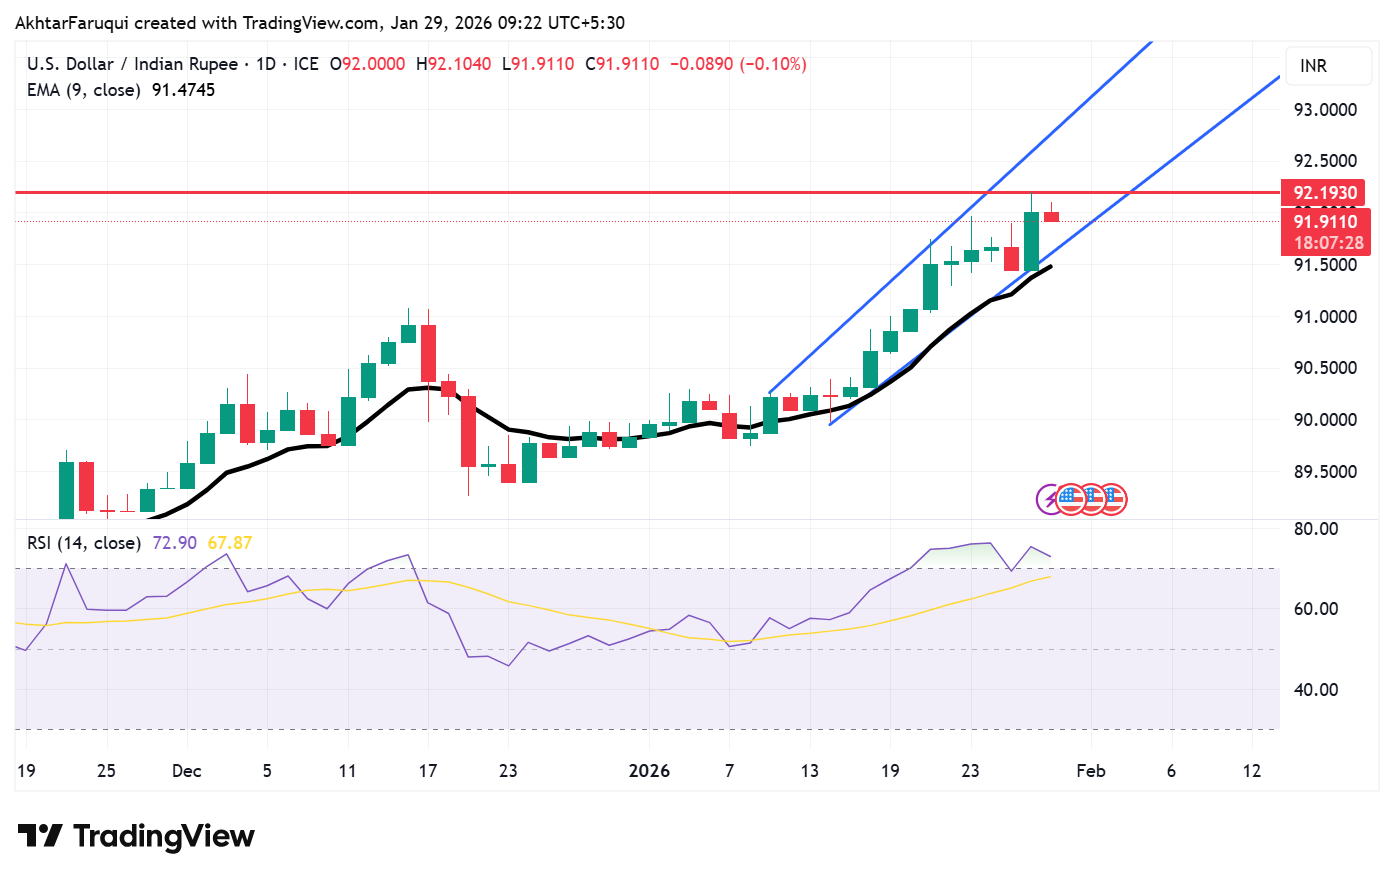
USD/INR edges lower after pulling back from record highs above 92.00
USD/INR is trading around 92.00 at the time of writing. Daily chart analysis points to a sustained bullish bias, with the pair rising within an ascending channel pattern. However, the 14-day Relative Strength Index (RSI) at 74.00 signals overbought conditions, suggesting the pair may be overstretched in the near term. This increases the risk of a corrective pullback or consolidation, even as the broader trend remains bullish.
Immediate resistance is seen at the January 28 all-time high of 92.19, followed by the upper boundary of the ascending channel near 92.70. On the downside, the initial support lies at the lower channel support around 91.60, followed by the nine-day Exponential Moving Average (EMA) at 91.48.
US Dollar Price Today
The table below shows the percentage change of US Dollar (USD) against listed major currencies today. US Dollar was the strongest against the Indian Rupee.
| USD | EUR | GBP | JPY | CAD | AUD | NZD | INR | |
|---|---|---|---|---|---|---|---|---|
| USD | -0.31% | -0.21% | -0.26% | -0.23% | -0.60% | -0.41% | -0.13% | |
| EUR | 0.31% | 0.10% | 0.02% | 0.08% | -0.29% | -0.11% | 0.18% | |
| GBP | 0.21% | -0.10% | -0.04% | -0.02% | -0.41% | -0.22% | 0.06% | |
| JPY | 0.26% | -0.02% | 0.04% | 0.03% | -0.33% | -0.17% | 0.11% | |
| CAD | 0.23% | -0.08% | 0.02% | -0.03% | -0.36% | -0.19% | 0.11% | |
| AUD | 0.60% | 0.29% | 0.41% | 0.33% | 0.36% | 0.19% | 0.45% | |
| NZD | 0.41% | 0.11% | 0.22% | 0.17% | 0.19% | -0.19% | 0.30% | |
| INR | 0.13% | -0.18% | -0.06% | -0.11% | -0.11% | -0.45% | -0.30% |
The heat map shows percentage changes of major currencies against each other. The base currency is picked from the left column, while the quote currency is picked from the top row. For example, if you pick the US Dollar from the left column and move along the horizontal line to the Japanese Yen, the percentage change displayed in the box will represent USD (base)/JPY (quote).
Indian Rupee FAQs
The Indian Rupee (INR) is one of the most sensitive currencies to external factors. The price of Crude Oil (the country is highly dependent on imported Oil), the value of the US Dollar – most trade is conducted in USD – and the level of foreign investment, are all influential. Direct intervention by the Reserve Bank of India (RBI) in FX markets to keep the exchange rate stable, as well as the level of interest rates set by the RBI, are further major influencing factors on the Rupee.
The Reserve Bank of India (RBI) actively intervenes in forex markets to maintain a stable exchange rate, to help facilitate trade. In addition, the RBI tries to maintain the inflation rate at its 4% target by adjusting interest rates. Higher interest rates usually strengthen the Rupee. This is due to the role of the ‘carry trade’ in which investors borrow in countries with lower interest rates so as to place their money in countries’ offering relatively higher interest rates and profit from the difference.
Macroeconomic factors that influence the value of the Rupee include inflation, interest rates, the economic growth rate (GDP), the balance of trade, and inflows from foreign investment. A higher growth rate can lead to more overseas investment, pushing up demand for the Rupee. A less negative balance of trade will eventually lead to a stronger Rupee. Higher interest rates, especially real rates (interest rates less inflation) are also positive for the Rupee. A risk-on environment can lead to greater inflows of Foreign Direct and Indirect Investment (FDI and FII), which also benefit the Rupee.
Higher inflation, particularly, if it is comparatively higher than India’s peers, is generally negative for the currency as it reflects devaluation through oversupply. Inflation also increases the cost of exports, leading to more Rupees being sold to purchase foreign imports, which is Rupee-negative. At the same time, higher inflation usually leads to the Reserve Bank of India (RBI) raising interest rates and this can be positive for the Rupee, due to increased demand from international investors. The opposite effect is true of lower inflation.
Recommended Articles


Comments (0)
Click the $ button, enter the symbol, and select to link a stock, ETF, or other ticker.