

EUR/USD surges above 1.1640 as Trump escalates US–EU trade war

- EUR/USD rallies over 0.40% as investors dump the Dollar amid escalating US–EU trade tensions.
- Trump’s tariff threats revive trade war fears, triggering a risk-off move across global markets.
- Focus turns to EU retaliation plans and Davos headlines as Fed enters blackout period.
EUR/USD edges higher on Monday up by more than 0.40% as traders ditch the US Dollar as risk appetite deteriorates following Trump’s decision to escalate the US-European Union trade war amid the White House interests over Greenland. The pair trades at 1.1642 after bouncing off daily lows of 1.1576.
Euro rebounds sharply as tariff threats over Greenland spark risk aversion
The financial markets began the week on risk-aversion mode after the White House imposed effective tariffs on February 1 on eight European countries until the US is allowed to buy Greenland. US President Donald Trump doubled down adding that if there’s no agreement, Denmark, Norway, Sweden, France, Germany, the Netherlands and the UK will face much higher duties since June 1.
Following Trump’s decision, the Dollar plunged, reacting in the same way when the White House announced April’s 2 Liberation Day last year. The US Dollar Index (DXY), which tracks the buck’s performance against a basket of six currencies, drops 0.32% down at 99.06.
Aside from this, the US economic docket remained absent. Worth noting that Federal Reserve officials began their blackout period ahead of the January 27-28 meeting.
In Europe, the EU is discussing retaliatory actions which include imposing €93 billion tariffs on American goods. Earlier, inflation data dipped below the European Central Bank 2% threshold, reinforcing that interest rates would remain on hold for the whole year.
What’s on the schedule for January 20?
The World Economic Forum in Davos would kick in. in Europe the docket will feature the Producer Price Index (PPI) in Germany and the meeting of Economic Finance ministers. In the US, the docket would feature the ADP Employment Change 4-weem average.
Euro Price This Month
The table below shows the percentage change of Euro (EUR) against listed major currencies this month. Euro was the strongest against the Canadian Dollar.
USD | EUR | GBP | JPY | CAD | AUD | NZD | CHF | |
|---|---|---|---|---|---|---|---|---|
USD | 0.91% | 0.41% | 1.08% | 1.23% | -0.61% | -0.14% | 0.64% | |
EUR | -0.91% | -0.55% | 0.18% | 0.39% | -1.12% | -0.97% | -0.20% | |
GBP | -0.41% | 0.55% | 0.74% | 0.95% | -0.60% | -0.43% | 0.35% | |
JPY | -1.08% | -0.18% | -0.74% | 0.10% | -1.54% | -1.64% | -0.29% | |
CAD | -1.23% | -0.39% | -0.95% | -0.10% | -1.64% | -1.74% | -0.58% | |
AUD | 0.61% | 1.12% | 0.60% | 1.54% | 1.64% | 0.17% | 0.96% | |
NZD | 0.14% | 0.97% | 0.43% | 1.64% | 1.74% | -0.17% | 0.78% | |
CHF | -0.64% | 0.20% | -0.35% | 0.29% | 0.58% | -0.96% | -0.78% |
The heat map shows percentage changes of major currencies against each other. The base currency is picked from the left column, while the quote currency is picked from the top row. For example, if you pick the Euro from the left column and move along the horizontal line to the US Dollar, the percentage change displayed in the box will represent EUR (base)/USD (quote).
Daily digest market movers: Euro rallies as Trump’s erodes Dollar haven appeal
- US President Donald Trump announced new tariffs of 10% tariffs effective on February 1 to eight countries including Denmark, Norway, Sweden, France, Germany, Finland, the Netherlands and the UK. The duties will be imposed if there’s no agreement over Greenland annex or purchase. He doubled down his bet and said that tariffs would rise to 25% on June 1 unless agreements are reached.
- The European Union is reportedly preparing up to €93 billion in counter-tariffs on US goods and is also weighing measures that would restrict access for American companies to the European market, signaling a firm response to Washington’s latest trade actions.
- Data-wise inflation in the Euroarea eased from 2.1% to 1.9% in December, below estimates of 2%. It is the first time since May of last year that inflation is below the ECB’s target. Underlying inflation which excludes food and energy, dipped from 2.4% to 2.3%, according to Eurostat.
Technical outlook: EUR/USD bounces off the 200-day SMA, towards 1.1650
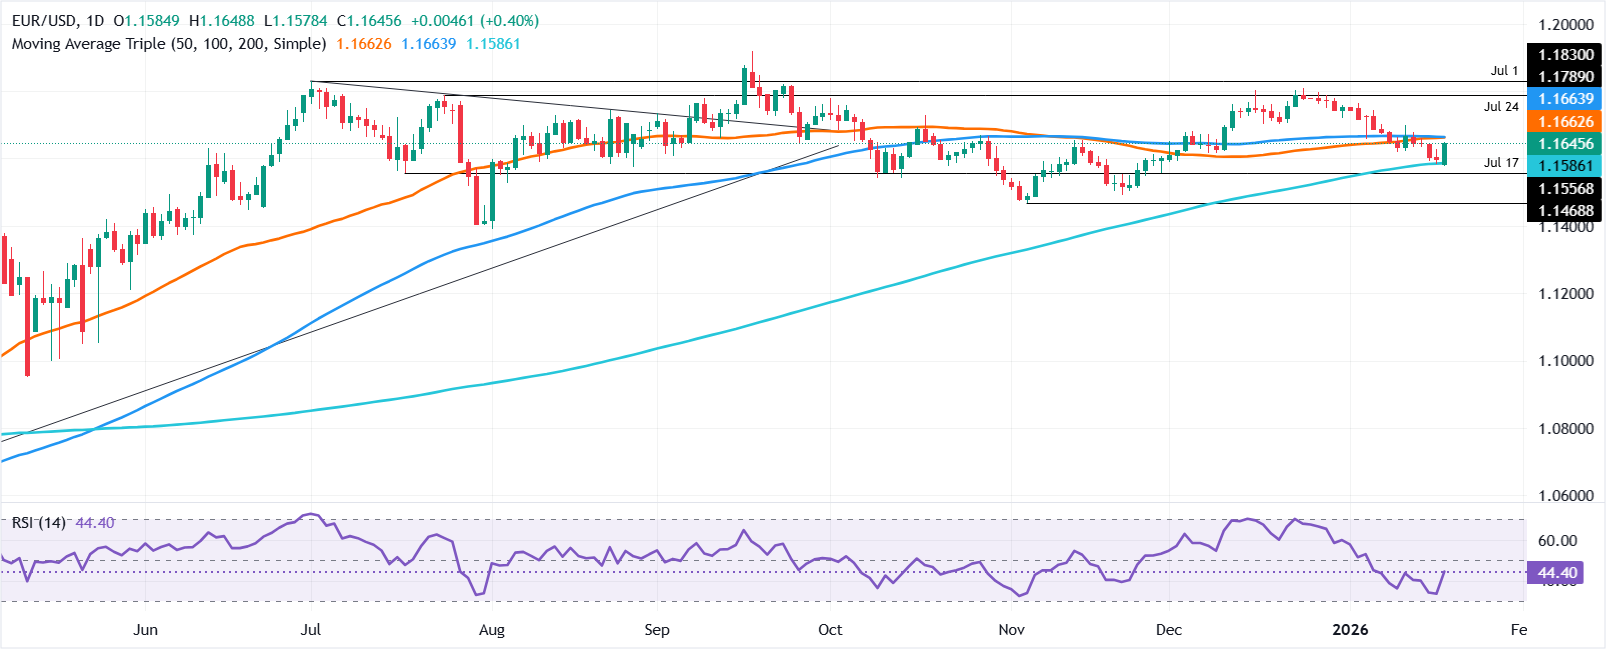
EUR/USD Daily Chart
EUR/USD rips higher on Monday as the Dollar losses its safety appeal on Trump’s trade war with the EU. The pair bounced off the 200-day Simple Moving Average (SMA) at 1.1586, posting a 60 plus pip gain and poised to clear key resistance levels up next.
From a momentum standpoint, the Relative Strength Index (RSI) shows buyers gathering some strength, but the index is slightly below its neutral level. Once cleared, it would be confirmation that bulls are outweighing bears and that the EUR/USD would be poised for higher prices.
The first key resistance is the 50-day SMA at 1.1656, followed by the 20-day SMA at 1.1695 ahead of 1.1700. A breach of that area could exacerbate a leg-up towards 1.1800. For the bearish case to gain traction, a renewed break below the 200-day Simple Moving Average (SMA) at 1.1586 would be crucial. If broken, down lies 1500, followed by scope for a deeper slide toward the August 1 low at 1.1391.
Recommended Articles


Comments (0)
Click the $ button, enter the symbol, and select to link a stock, ETF, or other ticker.