

EUR/USD drifts lower as US Dollar firms up supported by upbeat data

- The Euro remains on its back foot, capped below 1.1800 against a firmer US Dollar.
- Stronger-than-expected US jobless claims and manufacturing activity figures have underpinned the US Dollar's recovery.
- In Europe, France's political unrest is likely to weigh on the Euro in the absence of key fundamental drivers.
EUR/USD is heading lower for the third day in a row, trading at 1.1775 at the time of writing on Friday, down from the four-year highs above 1.1900 hit earlier this week. A larger-than-expected decline in weekly US Initial Jobless Claims and a sharp rebound in the Philadelphia Fed Manufacturing Survey provided additional support to the US Dollar on Wednesday.
In Europe, the calendar has been light, but a new wave of anti-austerity protests is gathering strength in France, which is adding weight to the Euro (EUR). Hundreds of thousands of people gathered in France's main cities on Thursday to pressure French President Emmanuel Macron and the new Prime Minister, Sébastien Lecornu, to scrap plans to cut spending proposed by the previous Prime Minister, François Bayrou.
Meanwhile, the US Supreme Court said that it will decide on the legality of trade tariffs on November 5. This has been one of the leading measures of US President Donald Trump's second term and was put into question by a lower court ruling that the republican overstepped his authority by invoking a federal law meant for emergencies.
All in all, the US Dollar (USD) maintains a mild positive tone with a neutral market mood and the absence of key fundamental data in Europe or the US. However, upside attempts in the Greenback are likely to remain contained, with investors pricing in further Federal Reserve (Fed) monetary easing in the coming months.
Euro Price Today
The table below shows the percentage change of Euro (EUR) against listed major currencies today. Euro was the strongest against the New Zealand Dollar.
| USD | EUR | GBP | JPY | CAD | AUD | NZD | CHF | |
|---|---|---|---|---|---|---|---|---|
| USD | 0.13% | 0.24% | -0.25% | 0.10% | 0.30% | 0.46% | 0.26% | |
| EUR | -0.13% | 0.13% | -0.43% | -0.03% | 0.15% | 0.34% | 0.13% | |
| GBP | -0.24% | -0.13% | -0.50% | -0.16% | 0.02% | 0.12% | -0.00% | |
| JPY | 0.25% | 0.43% | 0.50% | 0.31% | 0.68% | 0.78% | 0.36% | |
| CAD | -0.10% | 0.03% | 0.16% | -0.31% | 0.21% | 0.37% | 0.16% | |
| AUD | -0.30% | -0.15% | -0.02% | -0.68% | -0.21% | 0.19% | -0.02% | |
| NZD | -0.46% | -0.34% | -0.12% | -0.78% | -0.37% | -0.19% | -0.20% | |
| CHF | -0.26% | -0.13% | 0.00% | -0.36% | -0.16% | 0.02% | 0.20% |
The heat map shows percentage changes of major currencies against each other. The base currency is picked from the left column, while the quote currency is picked from the top row. For example, if you pick the Euro from the left column and move along the horizontal line to the US Dollar, the percentage change displayed in the box will represent EUR (base)/USD (quote).
Daily digest market movers: Strong data soothes investors and supports the US Dollar
- Weekly US Initial Jobless Claims dropped by 33,000 to 231,000 in the week of September 12, according to data released by the US Labor Department on Thursday. The numbers beat expectations of a softer decline to 240K from the previous 264K reading.
- Somewhat later, the Philly Fed Manufacturing Survey showed a larger-than-expected recovery of the sector's activity, with the index bouncing up to 23.2, its highest level since January, following a 0.3% contraction in August and also beating expectations of a 2.3 reading.
- These figures did not change the view that the Fed will be constrained to cut interest rates again in October, but have eased concerns about a sharp economic downturn, and provided additional support to the Greenback.
- Futures markets remain pricing in a 90% chance that the Fed will cut rates by another 25-basis-point (bps) month, and nearly 80% probability that the central bank will cut another quarter point in December. This feeling is likely to keep US Dollar rallies limited.
- On Thursday, ECB Vice President Luis de Guindos reiterated that the bank's monetary policy stance is "appropriate" at the moment but warned about the high economic uncertainty and affirmed that the monetary easing cycle may not be over yet in a dovish hint that added some pressure on the Euro.
Technical Analysis: EUR/USD key support is at the 1.1700 area
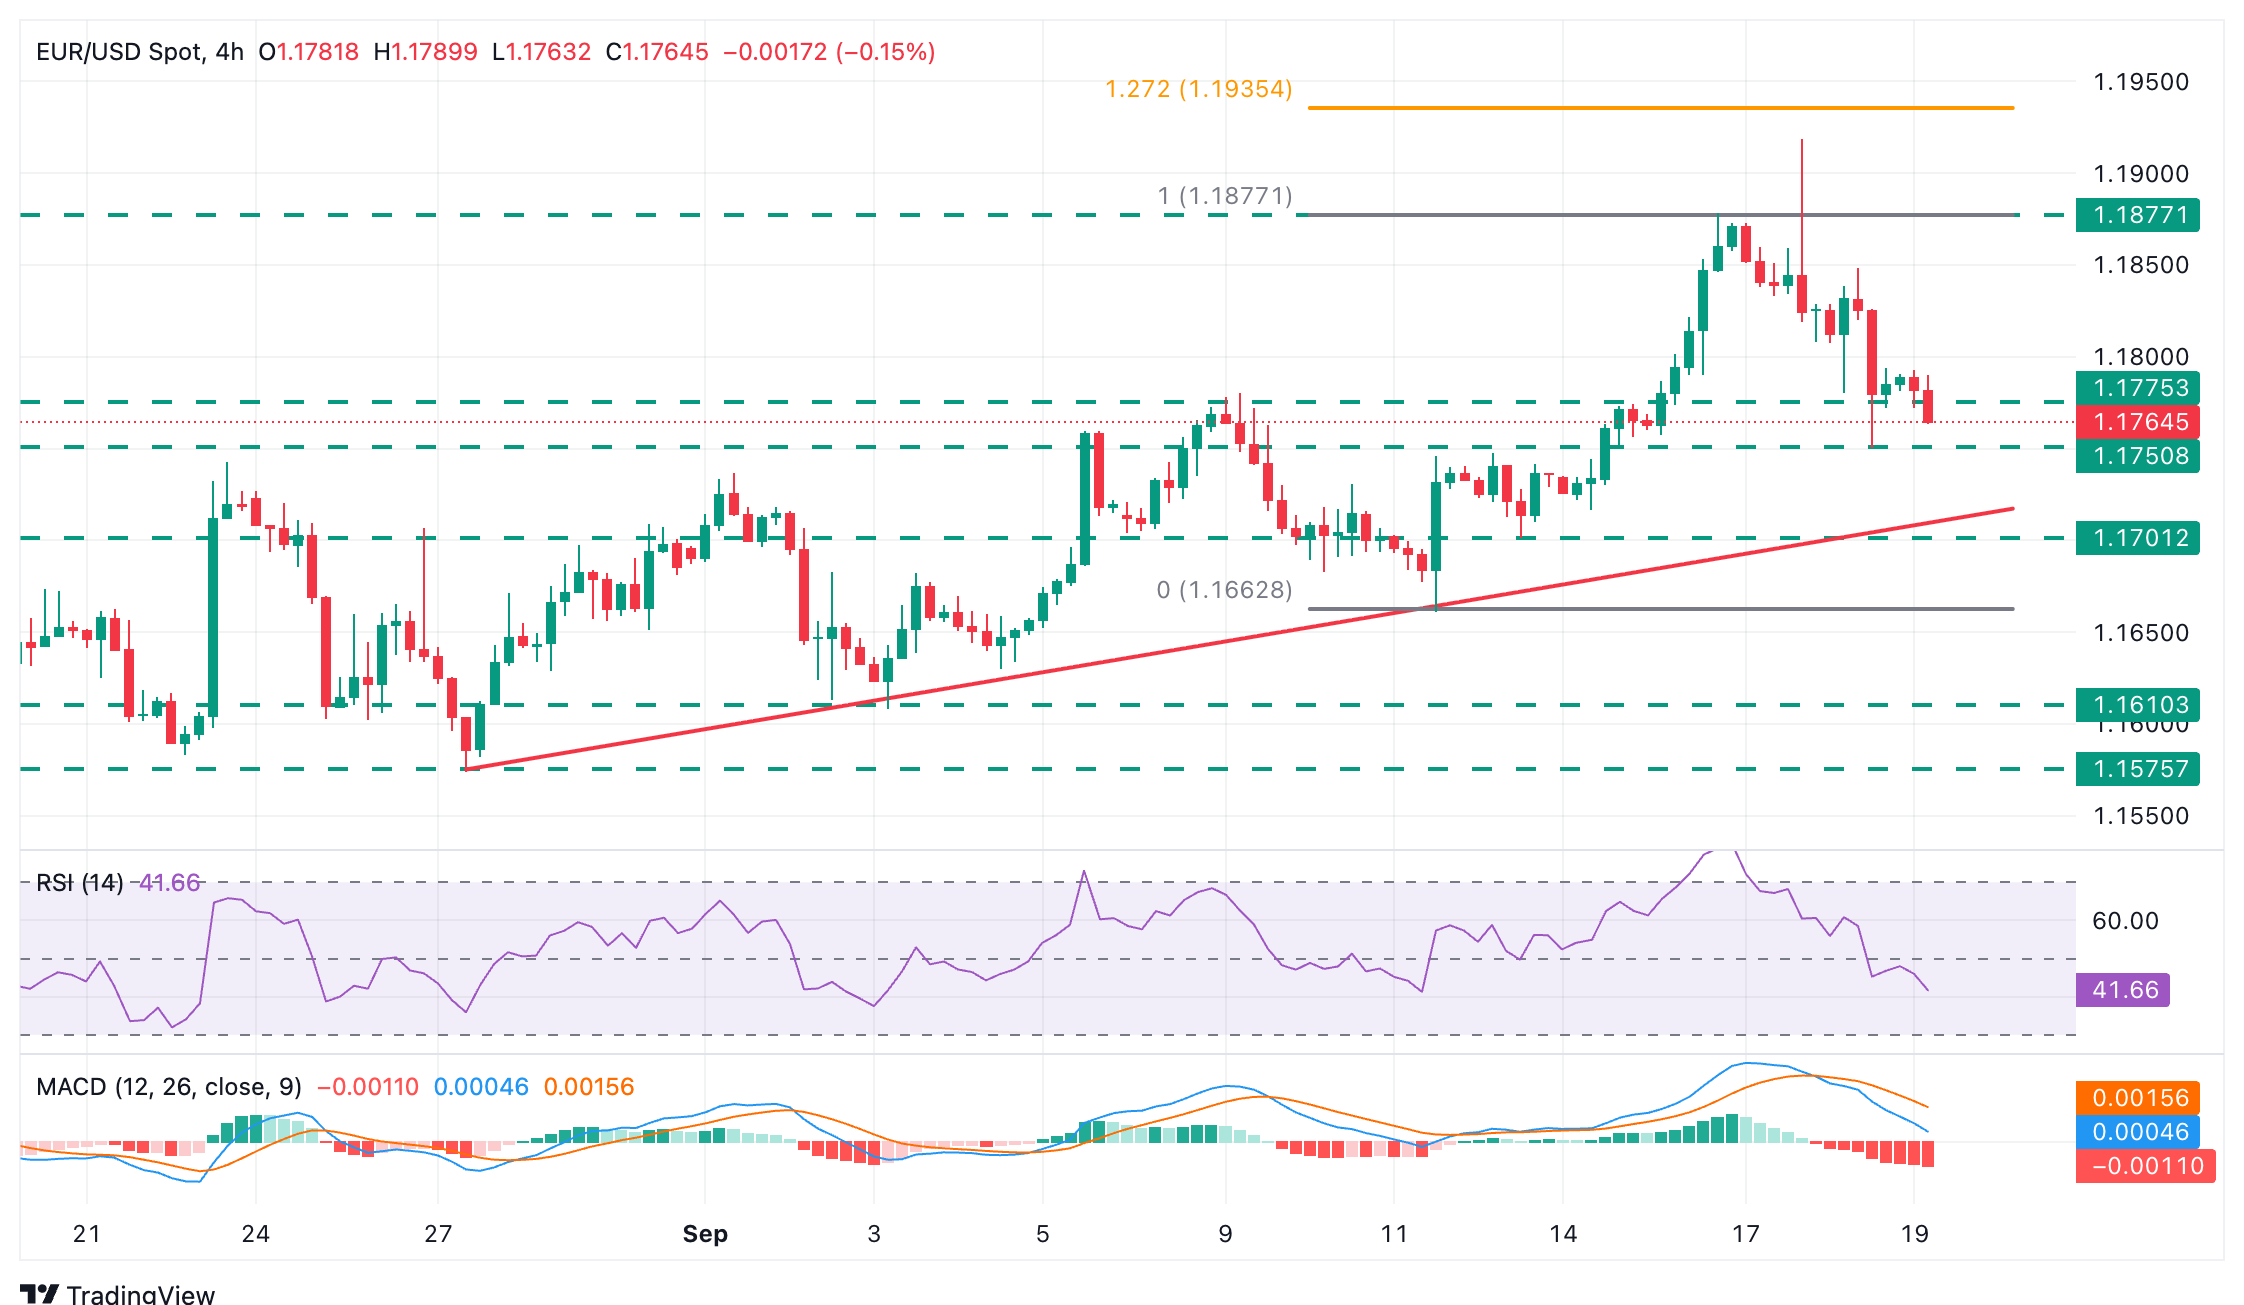
EUR/USD is accelerating its reversal from four-year highs, amid a stronger US Dollar. Technical indicators are showing an increasing bearish momentum, with the Relative Strength Index consolidating below the 50 level on the 4-hour chart, and with bears focusing on the 1.1750-1.1760 support area, which held downside attempts on September 15 and 18.
The key support area for the broader bullish trend, however, lies between the September 12 low at 1.1700 and the trendline support from late August lows, now around 1.1710. Further down, the next target is the September 11 low, near 1.1660.
To the upside, the intra-day high is at 1.1790, ahead of Thursday's peak near 1.1850 and the September 16 high at 1.1878.
Economic Indicator
Initial Jobless Claims
The Initial Jobless Claims released by the US Department of Labor is a measure of the number of people filing first-time claims for state unemployment insurance. A larger-than-expected number indicates weakness in the US labor market, reflects negatively on the US economy, and is negative for the US Dollar (USD). On the other hand, a decreasing number should be taken as bullish for the USD.
Last release: Thu Sep 18, 2025 12:30
Frequency: Weekly
Actual: 231K
Consensus: 240K
Previous: 263K
Source: US Department of Labor
Every Thursday, the US Department of Labor publishes the number of previous week’s initial claims for unemployment benefits in the US. Since this reading could be highly volatile, investors may pay closer attention to the four-week average. A downtrend is seen as a sign of an improving labour market and could have a positive impact on the USD’s performance against its rivals and vice versa.
Economic Indicator
Philadelphia Fed Manufacturing Survey
The Philadelphia Fed Survey is a spread index of manufacturing conditions (movements of manufacturing) within the Federal Reserve Bank of Philadelphia. This survey, served as an indicator of manufacturing sector trends, is interrelated with the ISM manufacturing Index (Institute for Supply Management) and the index of industrial production. It is also used as a forecast of The ISM Index. Generally, an above-the-expectaitons reading is seen as positive for the USD.
Last release: Thu Sep 18, 2025 12:30
Frequency: Monthly
Actual: 23.2
Consensus: 2.3
Previous: -0.3
Source: Federal Reserve Bank of Philadelphia
Recommended Articles


Comments (0)
Click the $ button, enter the symbol, and select to link a stock, ETF, or other ticker.