

Australian Dollar gains ground following rise in Q2 Private Capital Expenditure

- Australian Dollar appreciates as Private Capital Expenditure climbed 0.2% in Q2, against the expected 0.7% rise.
- The AUD gained support after hot Australian inflation data lowered expectations of an RBA rate cut.
- Fed Governor Lisa Cook’s exit could increase the likelihood of interest rate cuts.
The Australian Dollar (AUD) gains ground for the third successive session on Thursday, following the release of Private Capital Expenditure, which rose 0.2% in the second quarter, from the previous decline of 0.1% but falling short of the expected 0.7% increase. The AUD/USD holds ground as the US Dollar (USD) struggles over US Federal Reserve (Fed) concerns.
The AUD is also supported by hotter-than-expected Australian inflation data, which reduces expectations of a Reserve Bank of Australia (RBA) rate cut. Australia's Monthly Consumer Price Index jumped by 2.8% year-over-year in July, surpassing a 1.9% increase prior and 2.3% expected growth.
China’s chipmakers are seeking to triple the country’s total output of artificial intelligence processors next year, the Financial Times reported on Thursday. Traders are already cautious following US President Donald Trump’s warning of imposing a 200% tariff on Chinese goods if Beijing refuses to supply magnets to the United States (US), per Reuters. It is worth noting that any change in the Chinese economy could influence AUD as China and Australia are close trading partners.
Australian Dollar advances as US Dollar struggles ahead of GDP Annualized
- The US Dollar Index (DXY), which measures the value of the US Dollar against six major currencies, is remaining subdued and trading around 98.10 at the time of writing. Traders await the Q2 US Gross Domestic Product (GDP) Annualized due later on Thursday. Focus will shift toward July Personal Consumption Expenditures (PCE) Price Index data, the Fed's preferred inflation gauge.
- US President Donald Trump announced early Tuesday that he was removing Fed Governor Lisa Cook from her position on the Fed's board of directors. This is considered the first instance of a president firing a central bank governor in the Fed’s 111-year history. The dismissal of Fed Governor Cook could increase the likelihood of heavy interest rate cuts, given Trump’s ongoing pressure on the central bank to reduce borrowing costs.
- Traders are now pricing in more than 88% odds for a cut of at least a quarter-point at the Fed’s September meeting, up from 82% the previous week, according to the CME FedWatch tool.
- Trump has already nominated White House economist Stephen Miran to a temporary seat that expires in January and has suggested Miran could also be in the running for Cook’s position. Meanwhile, The Wall Street Journal reported that David Malpass, former World Bank president, is another potential candidate.
- President Trump threatened "subsequent additional tariffs" and export restrictions on advanced technology and semiconductors in retaliation for digital services taxes that hit American technology companies, per Bloomberg.
- Fed Chair Jerome Powell said at the Jackson Hole symposium on Friday that risks to the job market were rising, but also noted inflation remained a threat and that a decision wasn't set in stone. Powell also stated that the Fed still believes it may not need to tighten policy solely based on uncertain estimates that employment may be beyond its maximum sustainable level.
- The Reserve Bank of Australia (RBA) Minutes of its August monetary policy meeting suggested that board members agreed that some further reduction in the cash rate is likely to be needed in the coming year. RBA Meeting Minutes also indicated that policymakers consider the pace of rate cuts would be determined by incoming data and the balance of global risks.
Australian Dollar moves above 0.6500, EMAs
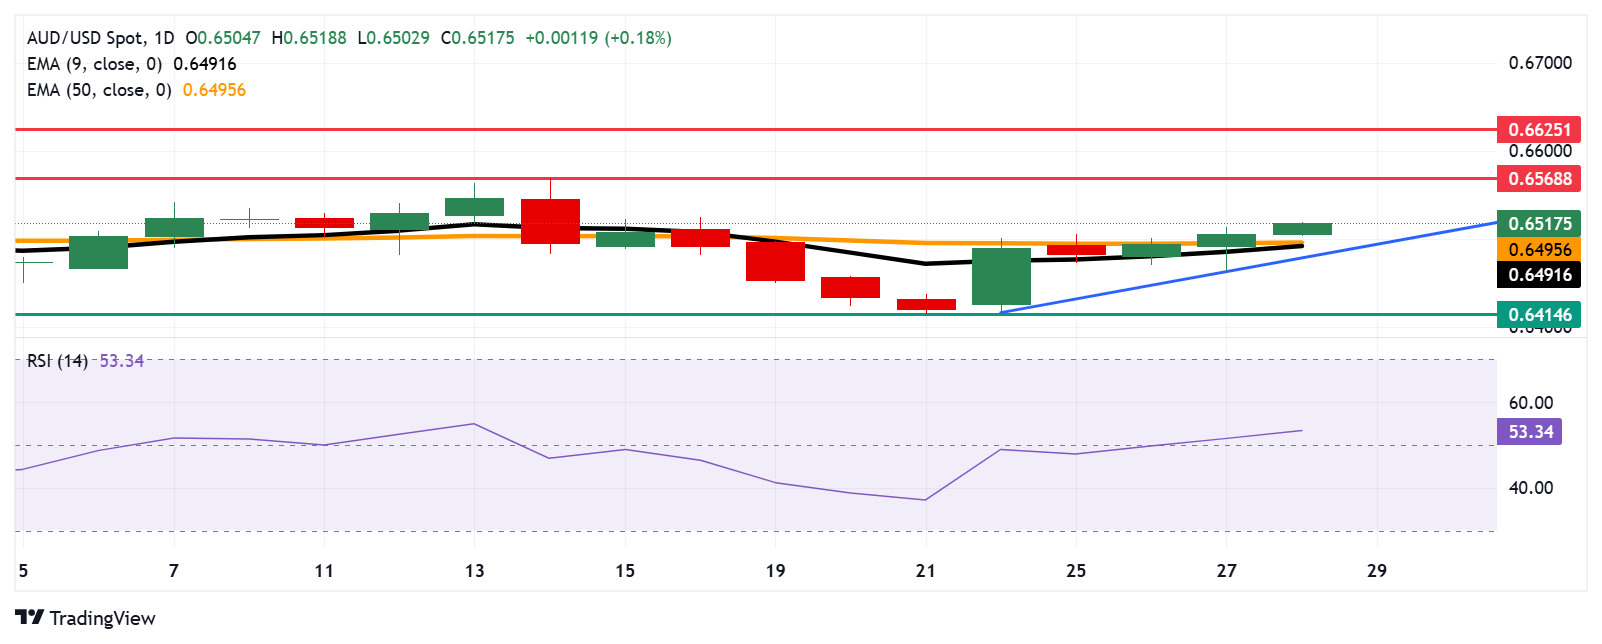
The AUD/USD pair is trading around 0.6510 on Thursday. The technical analysis of the daily chart indicates that the pair is positioned slightly above the ascending trendline, suggesting an emergence of a bullish bias. Additionally, the pair is trading above the nine-day Exponential Moving Average (EMA), indicating short-term price momentum is strengthening.
On the upside, the AUD/JPY pair may explore the region around the monthly high at 0.6568, reached on August 14, followed by the nine-month high of 0.6625, which was recorded on July 24.
The immediate support lies at the psychological level of 0.6500, aligned with the 50-day EMA of 0.6495 and the nine-day EMA of 0.6490. A break below these levels would weaken the medium- and short-term price momentum and put downward pressure to test the ascending trendline around 0.6480. Further declines would prompt the AUD/USD pair to test the two-month low of 0.6414, recorded on August 21.
AUD/USD: Daily Chart
Australian Dollar Price Today
The table below shows the percentage change of Australian Dollar (AUD) against listed major currencies today. Australian Dollar was the strongest against the US Dollar.
| USD | EUR | GBP | JPY | CAD | AUD | NZD | CHF | |
|---|---|---|---|---|---|---|---|---|
| USD | -0.12% | -0.14% | -0.12% | -0.09% | -0.18% | -0.01% | -0.21% | |
| EUR | 0.12% | 0.02% | 0.00% | 0.02% | -0.03% | 0.13% | -0.08% | |
| GBP | 0.14% | -0.02% | 0.00% | 0.05% | -0.05% | 0.13% | -0.07% | |
| JPY | 0.12% | 0.00% | 0.00% | 0.07% | -0.10% | -0.17% | -0.06% | |
| CAD | 0.09% | -0.02% | -0.05% | -0.07% | -0.10% | 0.08% | -0.02% | |
| AUD | 0.18% | 0.03% | 0.05% | 0.10% | 0.10% | 0.17% | -0.03% | |
| NZD | 0.00% | -0.13% | -0.13% | 0.17% | -0.08% | -0.17% | -0.19% | |
| CHF | 0.21% | 0.08% | 0.07% | 0.06% | 0.02% | 0.03% | 0.19% |
The heat map shows percentage changes of major currencies against each other. The base currency is picked from the left column, while the quote currency is picked from the top row. For example, if you pick the Australian Dollar from the left column and move along the horizontal line to the US Dollar, the percentage change displayed in the box will represent AUD (base)/USD (quote).
Economic Indicator
Private Capital Expenditure
The Private Capital Expenditure released by the Australian Bureau of Statistics measures current and future capital expenditure intentions of the private sector. It is considered as an indicator for inflationary pressures. A high reading is seen as positive (or bullish) for the AUD, while a low reading is seen as negative (or bearish).
Last release: Thu Aug 28, 2025 01:30
Frequency: Quarterly
Actual: 0.2%
Consensus: 0.7%
Previous: -0.1%
Source: Australian Bureau of Statistics
Recommended Articles


Comments (0)
Click the $ button, enter the symbol, and select to link a stock, ETF, or other ticker.