NZD/USD Price Analysis: Range-bound trade grapples with conflicting signals

- NZD/USD dips on Tuesday, hovering near 0.5670 amid a sideways pattern.
- RSI stands at 54, hinting at positive momentum yet showing signs of a pullback.
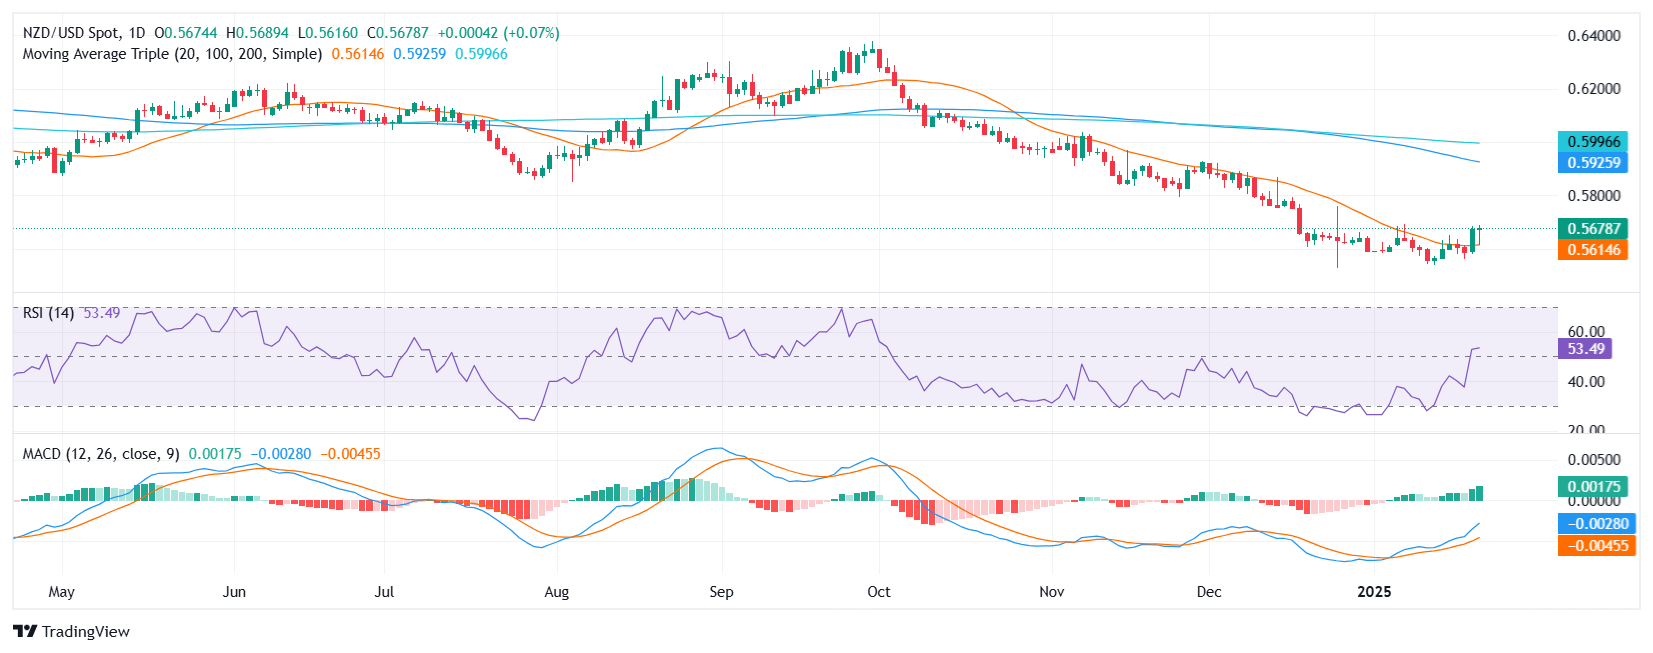
NZD/USD edged lower to 0.5670 on Tuesday, extending its recent stretch of range-bound action between 0.5690 and 0.5565. The pair’s inability to sustain a decisive move outside this corridor highlights traders’ indecision, with buyers and sellers each awaiting a clearer catalyst. Despite slipping slightly, NZD/USD remains close to the upper band of its established consolidation zone.
Technical readings offer a mixed outlook. Although the Relative Strength Index (RSI) stands at 54 in positive territory, it has shown signs of moderating from previous levels, suggesting that upward momentum may be losing steam. In contrast, the Moving Average Convergence Divergence (MACD) histogram is displaying rising green bars—often taken as an indication that buyers have not completely bowed out. As a result, the pair appears to be at a crossroads, needing a stronger push from either side.
Looking ahead, an upside break above 0.5690 would signal a potential bullish extension, possibly targeting 0.5720 or higher if momentum holds. On the downside, failure to maintain current levels could see bears aiming for 0.5565, which has served as a reliable floor throughout the recent consolidation.
NZD/USD daily chart


