

USD/JPY Price Prediction: Pulls back after breaking out of price pattern

FXStreetDec 2, 2024 1:36 PM
- USD/JPY pulls back after breaking out of a bearish price pattern.
- The pair is still in a bear trend, however and likely to continue lower.
USD/JPY pulls back after breaking out of a bearish Broadening Formation (BF) pattern and pulls back to the 50-day Simple Moving Average (SMA). The pair is probably in a short-term downtrend which is more likely than not to extend.
The first downside target lies at 148.54, the 61.8% Fibonacci extrapolation of the height of the pattern extrapolated lower.
USD/JPY Daily Chart
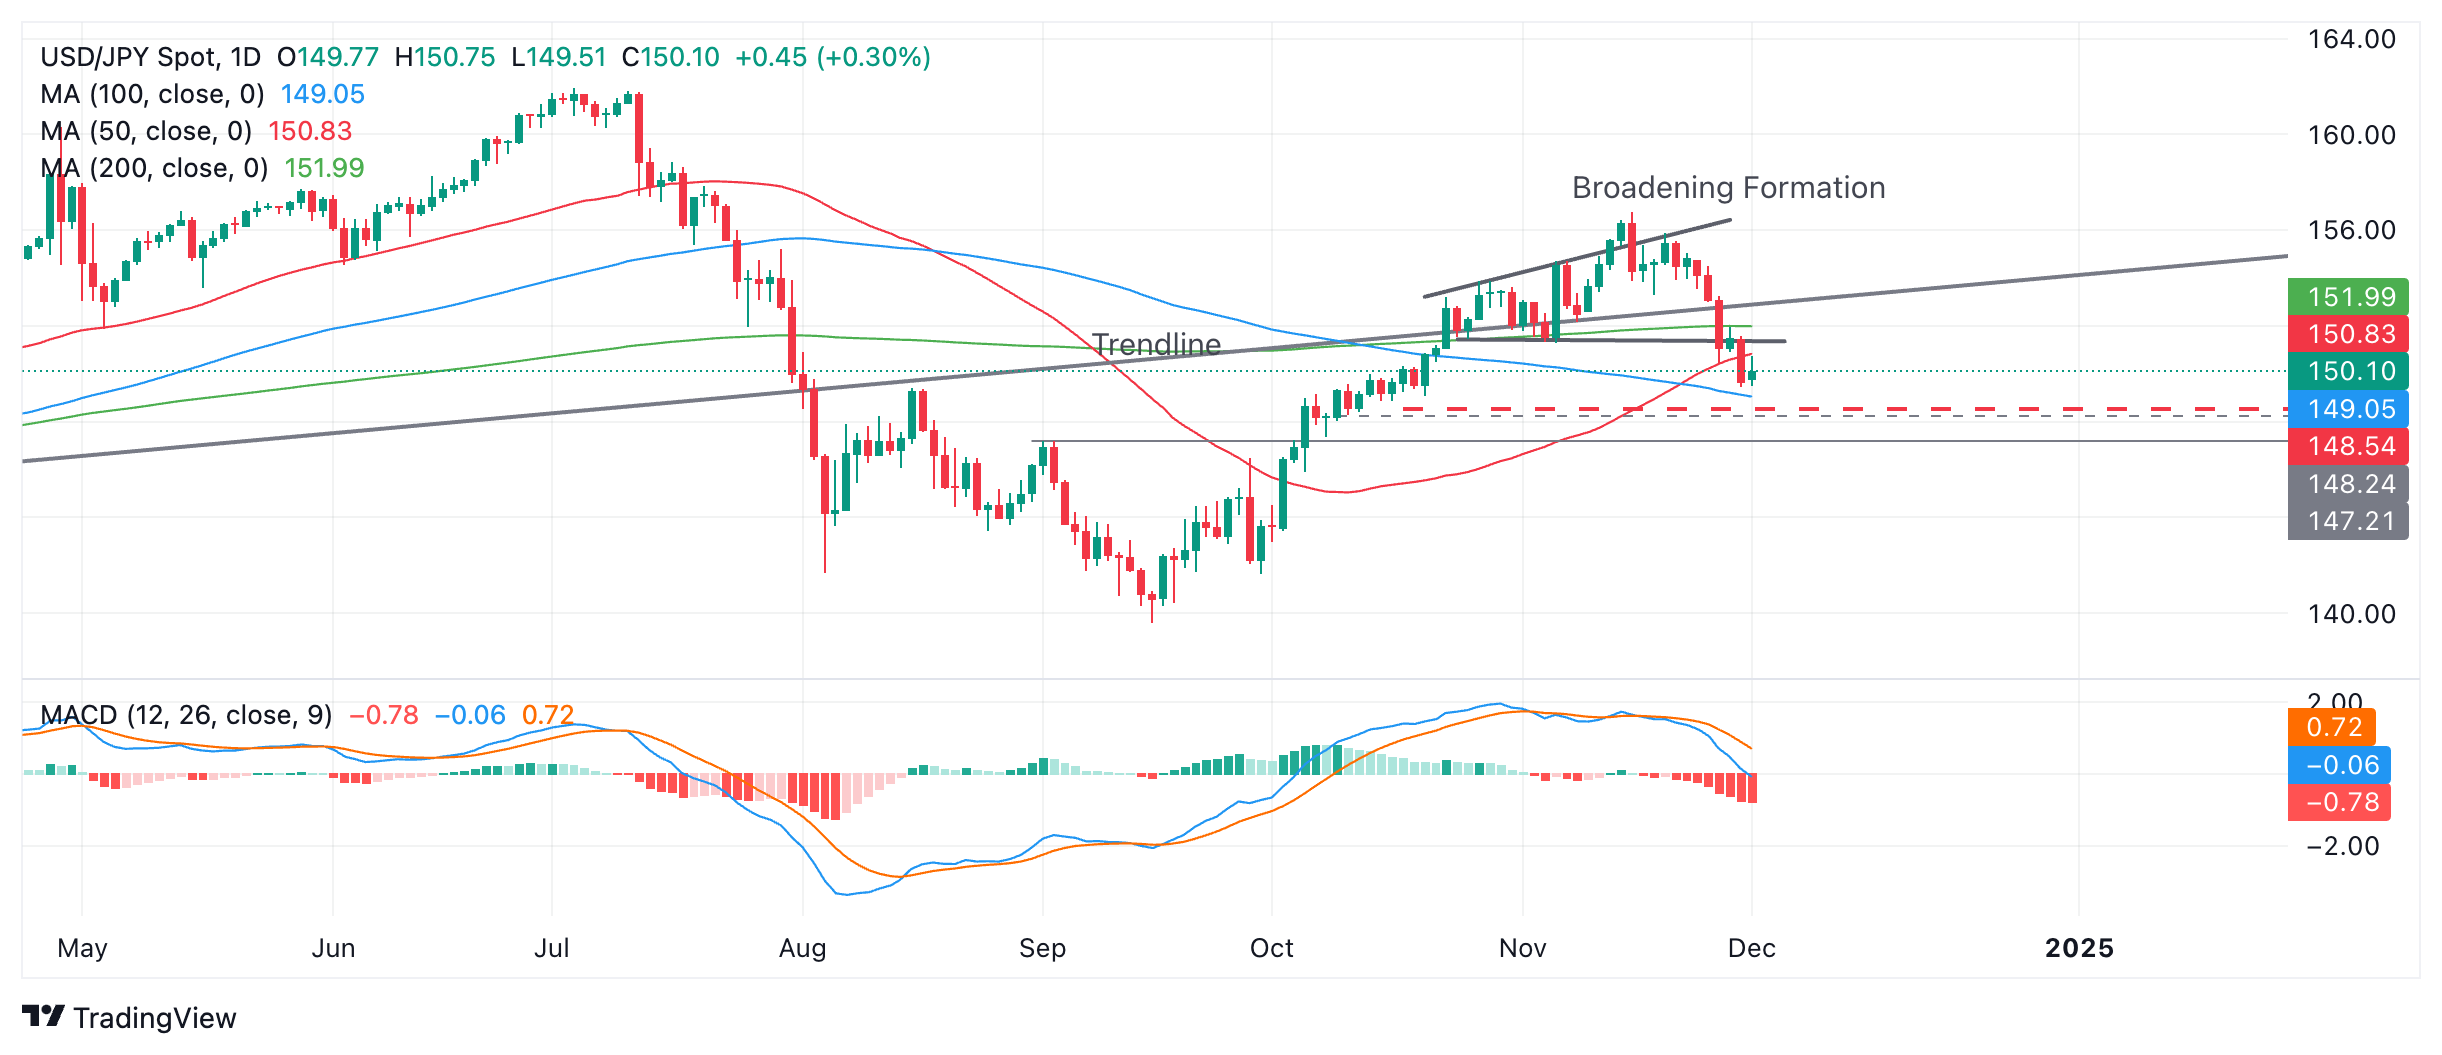
Further bearishness could carry USD/JPY to the next target at 148.24, the September 2, key swing high.
The (blue) Moving Average Convergence Divergence (MACD) momentum indicator is diverging away from its red signal line which is bearish and has fallen below the zero line on an intraday basis. If it closes below zero then it will increase the bearishness of the indicator reading.
Disclaimer: The information provided on this website is for educational and informational purposes only and should not be considered financial or investment advice.
Related Articles
$660B Capex Bill Triggers $900B Wipeout: Why Apple Shares Outperform Amazon and Google Despite AI Lag
Based on financial disclosures, the combined 2026 capital expenditure forecasts for Meta, Amazon, Google, and Microsoft are projected to reach $660 billion. This figure is not only significantly higher than the $410 billion forecast for 2025 and $245 billion for 2024, but even surpasses the GDP of ITradingKey
Fri, Feb 6

Amazon Stock Predictions for 2026 to 2030: Will They Exceed Expectations and Achieve Major Long-Term Goals?
TradingKey - As we head into 2026, many investors are questioning where Amazon (AMZN) fits into the technology world.TradingKey
Fri, Feb 6

A Crash After a Surge: Why Silver Lost 40% in a Week?
TradingKey - Spot silver (XAGUSD) prices continue to decline. Silver plunged 20% on Thursday, breaking below $71 per ounce, with the sell-off intensifying on Friday as prices fell further below $64. Compared to the all-time high set on January 29, silver prices have retraced more than 40%, wiping out nearly all gains accumulated over the previous month.TradingKey
Fri, Feb 6

Is Bitcoin’s Four-Year Cycle Dead in 2026?
Is the Bitcoin 4-year cycle dead? After 2025 broke historical records with a red post-halving year, institutional analysts explore if the Bitcoin price has decoupled from the halving countdown. Analyze the impact of spot ETFs, global liquidity, and the roadmap to the 2028 halving in this 2026 marketTradingKey
Wed, Feb 4


