

GBP/NZD Price Forecast: Testing upper borderline of channel, attempting breakout

FXStreetNov 26, 2024 2:53 PM
View all comments(0)
- GBP/NZD is testing the upper line of a falling channel and trying to breakout higher.
- A successful break higher could extend the established trend to upside targets.
GBP/NZD tests the upper tramline of a channel it has been falling in during the month of November. A successful breakout from the channel might lead to an extension higher towards resistance in the mid 2.1800s.
GBP/NZD Daily Chart
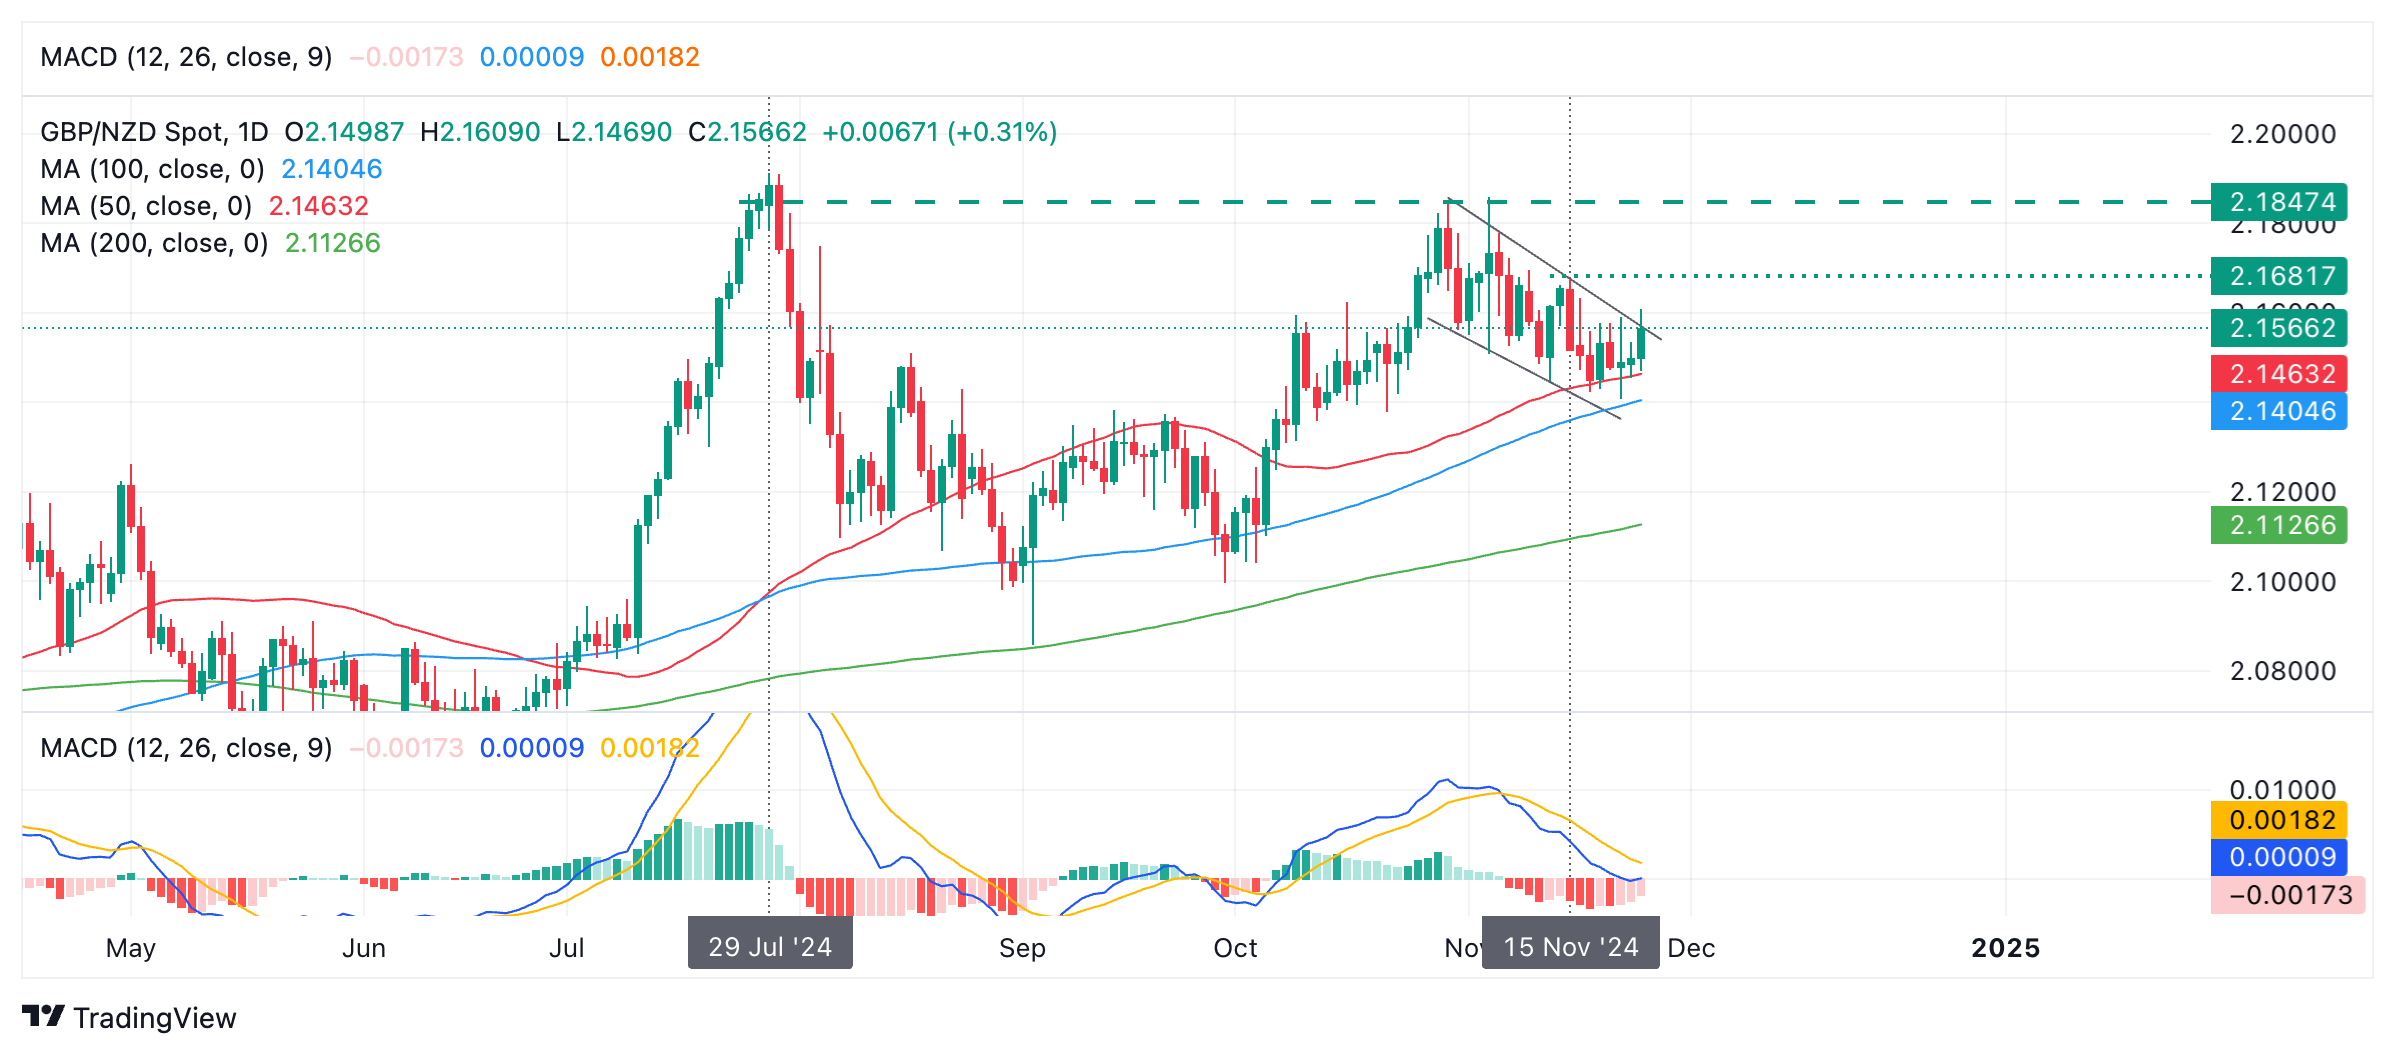
A break above 2.1675 – the November 15 high – would probably confirm such a move and result in a follow-through towards the upside target at 2.1845.
The (blue) Moving Average Convergence Divergence (MACD) momentum indicator is turning up at the end and looks poised to cross above its (red) signal line, confirming a buy signal. If such a cross accompanied a breakout from price, it would provide supporting evidence for an extension of GBP/NZD higher.
Disclaimer: The information provided on this website is for educational and informational purposes only and should not be considered financial or investment advice.
Like
Recommended Articles


Featured Tools


Top News

SpaceX (SPCX) Stock Price Forecast: $4.3B Nasdaq-100 Forced Buy Hits a 3% Float Stock

Microsoft Stock Price Forecast: Over 20% Slump in First Half of 2026, Will It Keep Falling in the Second Half?

Japan and South Korea Stocks Open Higher: Samsung Rallies 4% to Lead Chip Stock Surge, SK Hynix and Kioxia Follow Trend

PepsiCo Stock Rebounds From 52-Week Lows; Can Q2 Earnings Fuel a Bigger Rally?

The Week Ahead: US Stocks Face Liquidity Test After Independence Day Holiday. SpaceX Officially Joins Nasdaq 100 as Fed June Minutes Loom

Comments (0)
Click the $ button, enter the symbol, and select to link a stock, ETF, or other ticker.