

NZD/USD Price Analysis: Bearish bias persists, 20-day SMA gone

- NZD/USD declined by 0.50% on Monday to reach 0.6145.
- The RSI is in positive territory but declining, indicating a rising bearish traction.
- The pair lost the 20-day SMA which flash sell signals.
Monday's session saw the New Zealand Dollar weaken against its US counterpart, extending its losing streak to two days. The NZD/USD pair fell by 0.50% to a low of 0.6145, as the bears continued to dominate the market.
The Relative Strength Index (RSI) is currently at 50, which is in positive territory but has a negative slope which suggests that the bears are advancing. The Moving Average Convergence Divergence (MACD) printed red bars, a sign of a continuation of the bear’s momentum. This is aligned with the recent price action, which shows the bears are in control.
NZD/USD daily chart
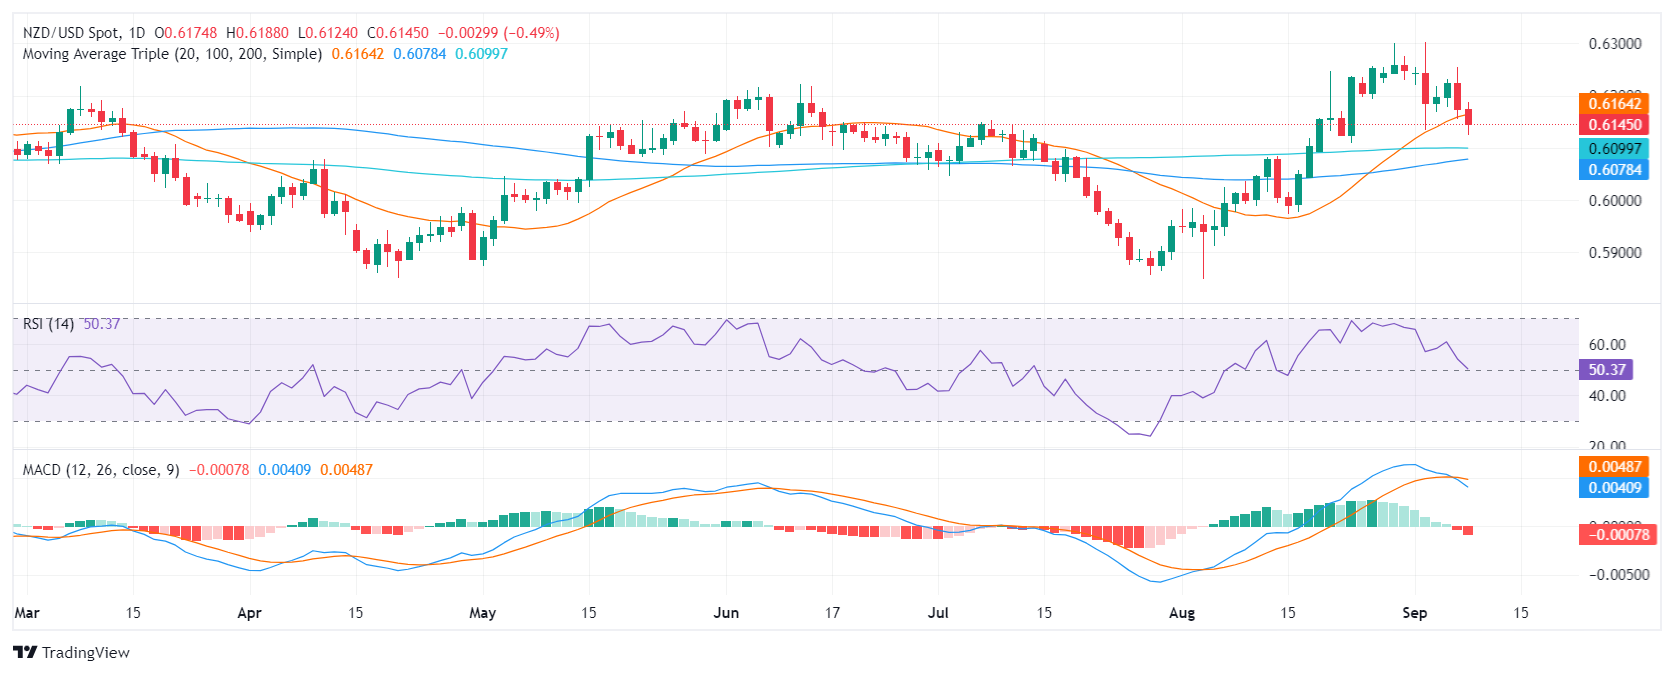
The 20-day Simple Moving Average (SMA) has now turned into a resistance level around the 0.6160 level and bulls will present support around the 0.6130 level and below at the psychological mark of 0.6100. The pair must recover the mentioned average to stop the bleeding.
.
Related Articles
$660B Capex Bill Triggers $900B Wipeout: Why Apple Shares Outperform Amazon and Google Despite AI Lag
Based on financial disclosures, the combined 2026 capital expenditure forecasts for Meta, Amazon, Google, and Microsoft are projected to reach $660 billion. This figure is not only significantly higher than the $410 billion forecast for 2025 and $245 billion for 2024, but even surpasses the GDP of I
Amazon Stock Predictions for 2026 to 2030: Will They Exceed Expectations and Achieve Major Long-Term Goals?
TradingKey - As we head into 2026, many investors are questioning where Amazon (AMZN) fits into the technology world.
A Crash After a Surge: Why Silver Lost 40% in a Week?
TradingKey - Spot silver (XAGUSD) prices continue to decline. Silver plunged 20% on Thursday, breaking below $71 per ounce, with the sell-off intensifying on Friday as prices fell further below $64. Compared to the all-time high set on January 29, silver prices have retraced more than 40%, wiping out nearly all gains accumulated over the previous month.
Is Bitcoin’s Four-Year Cycle Dead in 2026?
Is the Bitcoin 4-year cycle dead? After 2025 broke historical records with a red post-halving year, institutional analysts explore if the Bitcoin price has decoupled from the halving countdown. Analyze the impact of spot ETFs, global liquidity, and the roadmap to the 2028 halving in this 2026 market

