

NZD/JPY Price Analysis: Bears seize control, key 20-day SMA broken breached
- NZD/JPY ended Thursday's session with a significant decline.
- The bears successfully pushed the pair below the crucial 20-day SMA, signaling a shift in command.
In Thursday's trading session, the NZD/JPY pair dropped substantially, losing 1.40% to land at 96.80. The pair slipped below the 20-day Simple Moving Average (SMA) of 97.70, indicating a negative outlook in the short-term as the outlook is now somewhat bearish at least for the short-term.
On the daily chart, the Relative Strength Index (RSI) plummeted to 44. This swift shift towards negative territory suggests a decline in market momentum, and it is important to note that the RSI shifted from nearly overbought terrain to below the middle point. The Moving Average Convergence Divergence (MACD) also adds weight to this bearish scenario, registering rising red bars indicative of decreased buying momentum.
NZD/JPY daily chart
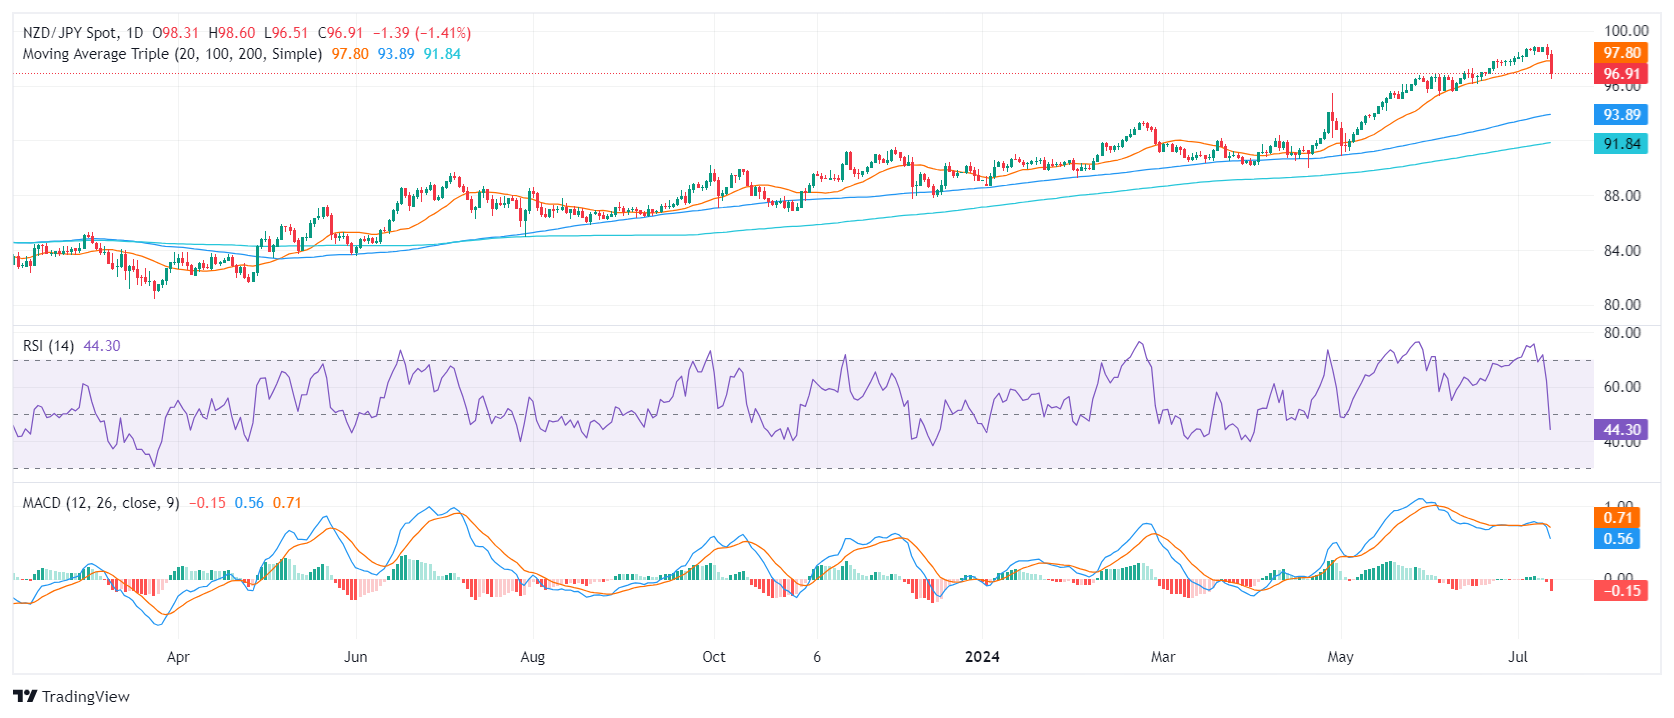
In light of the bearish turn, immediate support levels are now set at 96.50, 96.00, and further down to 95.00. In contrast, resistance is now likely to be encountered at previous support levels of 97.00, 97.70 (20-day SMA), and 98.00.
Related Articles
$660B Capex Bill Triggers $900B Wipeout: Why Apple Shares Outperform Amazon and Google Despite AI Lag
Based on financial disclosures, the combined 2026 capital expenditure forecasts for Meta, Amazon, Google, and Microsoft are projected to reach $660 billion. This figure is not only significantly higher than the $410 billion forecast for 2025 and $245 billion for 2024, but even surpasses the GDP of I
Amazon Stock Predictions for 2026 to 2030: Will They Exceed Expectations and Achieve Major Long-Term Goals?
TradingKey - As we head into 2026, many investors are questioning where Amazon (AMZN) fits into the technology world.
A Crash After a Surge: Why Silver Lost 40% in a Week?
TradingKey - Spot silver (XAGUSD) prices continue to decline. Silver plunged 20% on Thursday, breaking below $71 per ounce, with the sell-off intensifying on Friday as prices fell further below $64. Compared to the all-time high set on January 29, silver prices have retraced more than 40%, wiping out nearly all gains accumulated over the previous month.
Is Bitcoin’s Four-Year Cycle Dead in 2026?
Is the Bitcoin 4-year cycle dead? After 2025 broke historical records with a red post-halving year, institutional analysts explore if the Bitcoin price has decoupled from the halving countdown. Analyze the impact of spot ETFs, global liquidity, and the roadmap to the 2028 halving in this 2026 market

