

NZD/USD Price Analysis: Bears tests critical support of 20-day SMA
- NZD/USD saw slight losses but maintained a position above the crucial 20-day SMA support around 0.6120.
- The technical outlook remains positive, despite Monday's bearish activity.
- Bears are testing the 20-day SMA strength.
On Monday, the NZD/USD struggled, losing 0.30% to 0.6125, erasing its daily gains. Despite this, the pair successfully defended its position above the 20-day Simple Moving Average (SMA) support level at 0.6120, a feat securely achieved in the past week.
As for the daily technical indicators, the Relative Strength Index (RSI) now stands at 53, showing a downward movement, indicating that the bullish momentum took a slight hit. The Moving Average Convergence Divergence (MACD) keeps on printing decreasing red bars, noting the fading bearish strength.
NZD/USD daily chart
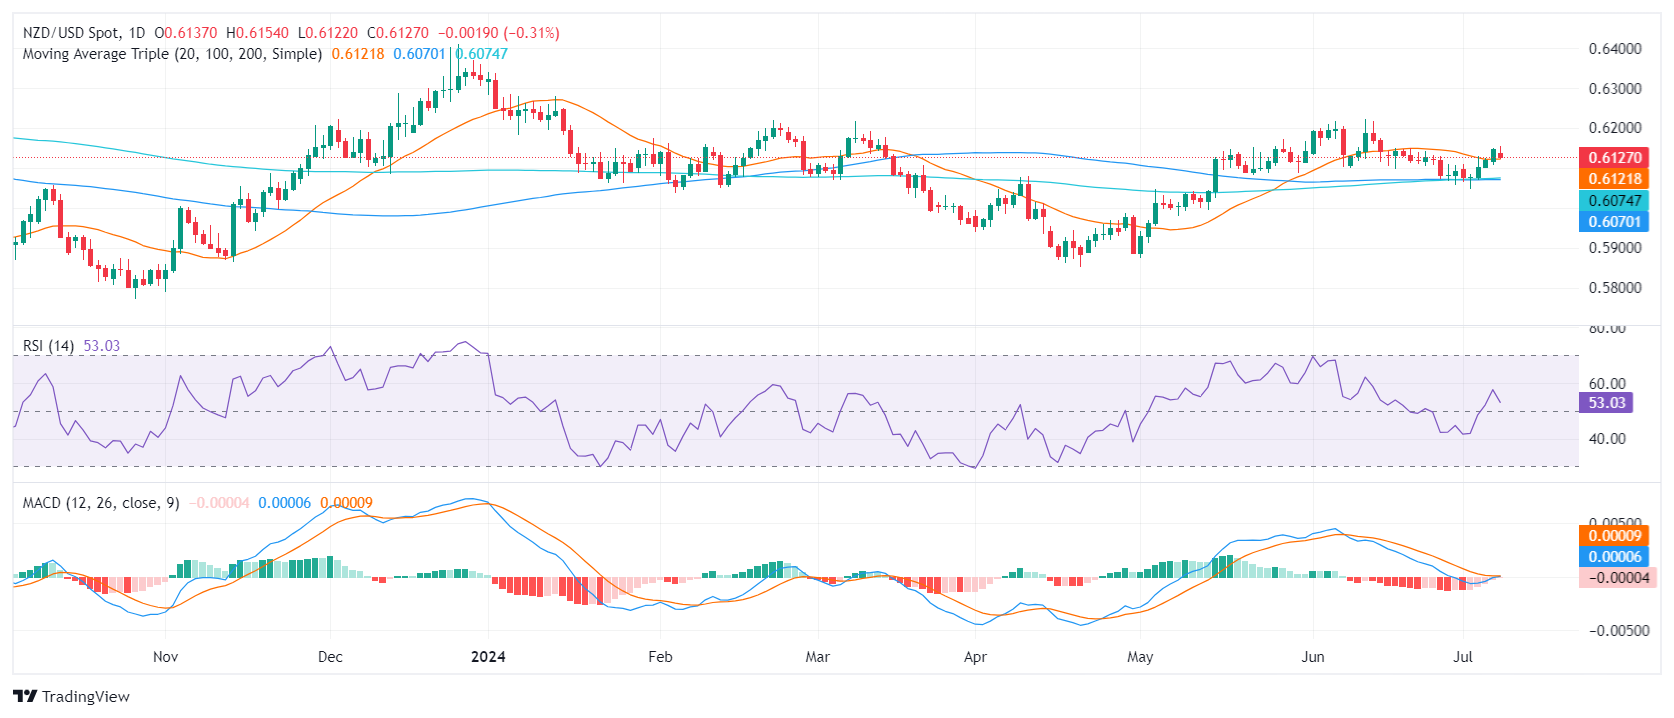
From the perspective of resistances, the 0.6170 level is the immediate challenge, which is trailed closely by the significant 0.6200 mark. A firm break above these levels can be viewed as a full confirmation of the recent bullish momentum, taking the pair deeper into bullish territory.
Ahead lies immediate support near the 20-day SMA at 0.6120, with stronger support at the decisive 0.6070 mark. If the sellers manage to lower the price below these supports, it will indicate a developing selling pressure that could lead to a deeper corrective decline.
Related Articles
$660B Capex Bill Triggers $900B Wipeout: Why Apple Shares Outperform Amazon and Google Despite AI Lag
Based on financial disclosures, the combined 2026 capital expenditure forecasts for Meta, Amazon, Google, and Microsoft are projected to reach $660 billion. This figure is not only significantly higher than the $410 billion forecast for 2025 and $245 billion for 2024, but even surpasses the GDP of I
Amazon Stock Predictions for 2026 to 2030: Will They Exceed Expectations and Achieve Major Long-Term Goals?
TradingKey - As we head into 2026, many investors are questioning where Amazon (AMZN) fits into the technology world.
A Crash After a Surge: Why Silver Lost 40% in a Week?
TradingKey - Spot silver (XAGUSD) prices continue to decline. Silver plunged 20% on Thursday, breaking below $71 per ounce, with the sell-off intensifying on Friday as prices fell further below $64. Compared to the all-time high set on January 29, silver prices have retraced more than 40%, wiping out nearly all gains accumulated over the previous month.
Is Bitcoin’s Four-Year Cycle Dead in 2026?
Is the Bitcoin 4-year cycle dead? After 2025 broke historical records with a red post-halving year, institutional analysts explore if the Bitcoin price has decoupled from the halving countdown. Analyze the impact of spot ETFs, global liquidity, and the roadmap to the 2028 halving in this 2026 market

