

EUR/GBP Price Analysis: Forms reversal pattern and begins falling again
- EUR/GBP forms a two bar reversal pattern and begins descending.
- This follows price filling a gap on the charts – another reversal sign.
- The correction from the June 14 lows may have ended and a new leg of the intermediate downtrend could be evolving.
EUR/GBP has moved lower after filling the price gap that opened between 0.8472 and 0.8490 (red shaded area) during the steep decline of June 10.
The pair has formed a two-bar reversal pattern on July 1-2 (light blue rectangle) which is a bearish reversal sign. These patterns form after an up move when a green candle is succeeded by a red candle of a similar shape and size. The pattern indicates a reversal of sentiment at a peak. This and the gap-fill increase the odds the up move from the June 14 lows has finished. It is likely the pair is probably rolling over and entering a bearish phase.
EUR/GBP Daily Chart
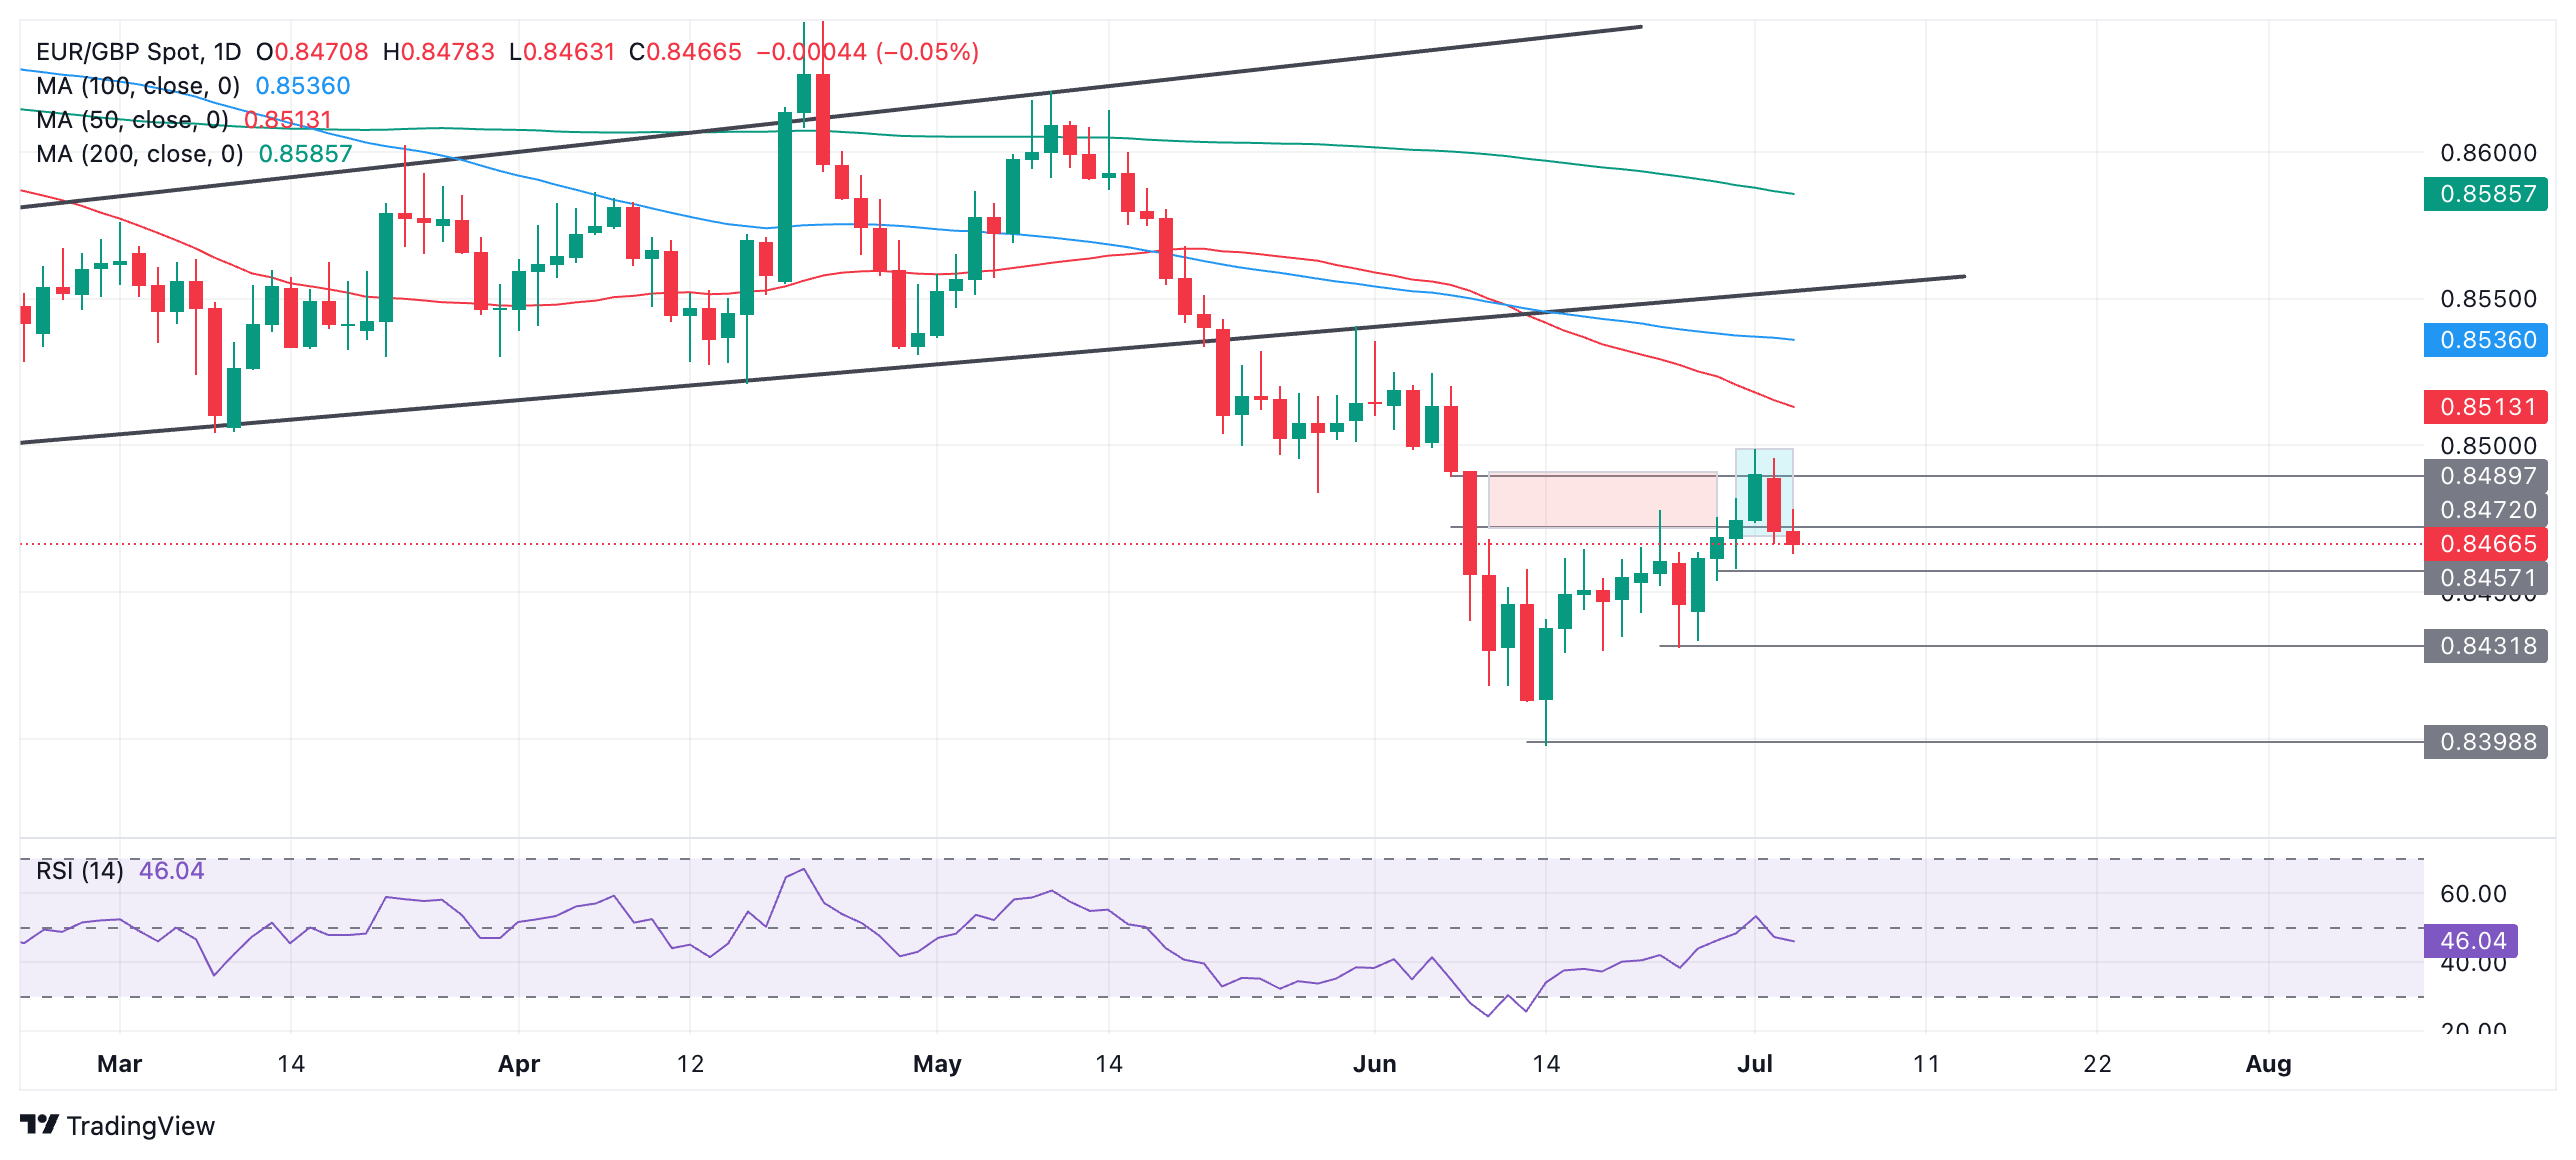
Taken together with the fact that the pair seems to be in a medium-term downtrend and “the trend is your friend” the odds favor a resumption lower.
A break below 0.8457 (June 28 low) would add confirmation.
The next target below that would be the 0.8431 June 25 low.
EUR/GBP 4-hour Chart
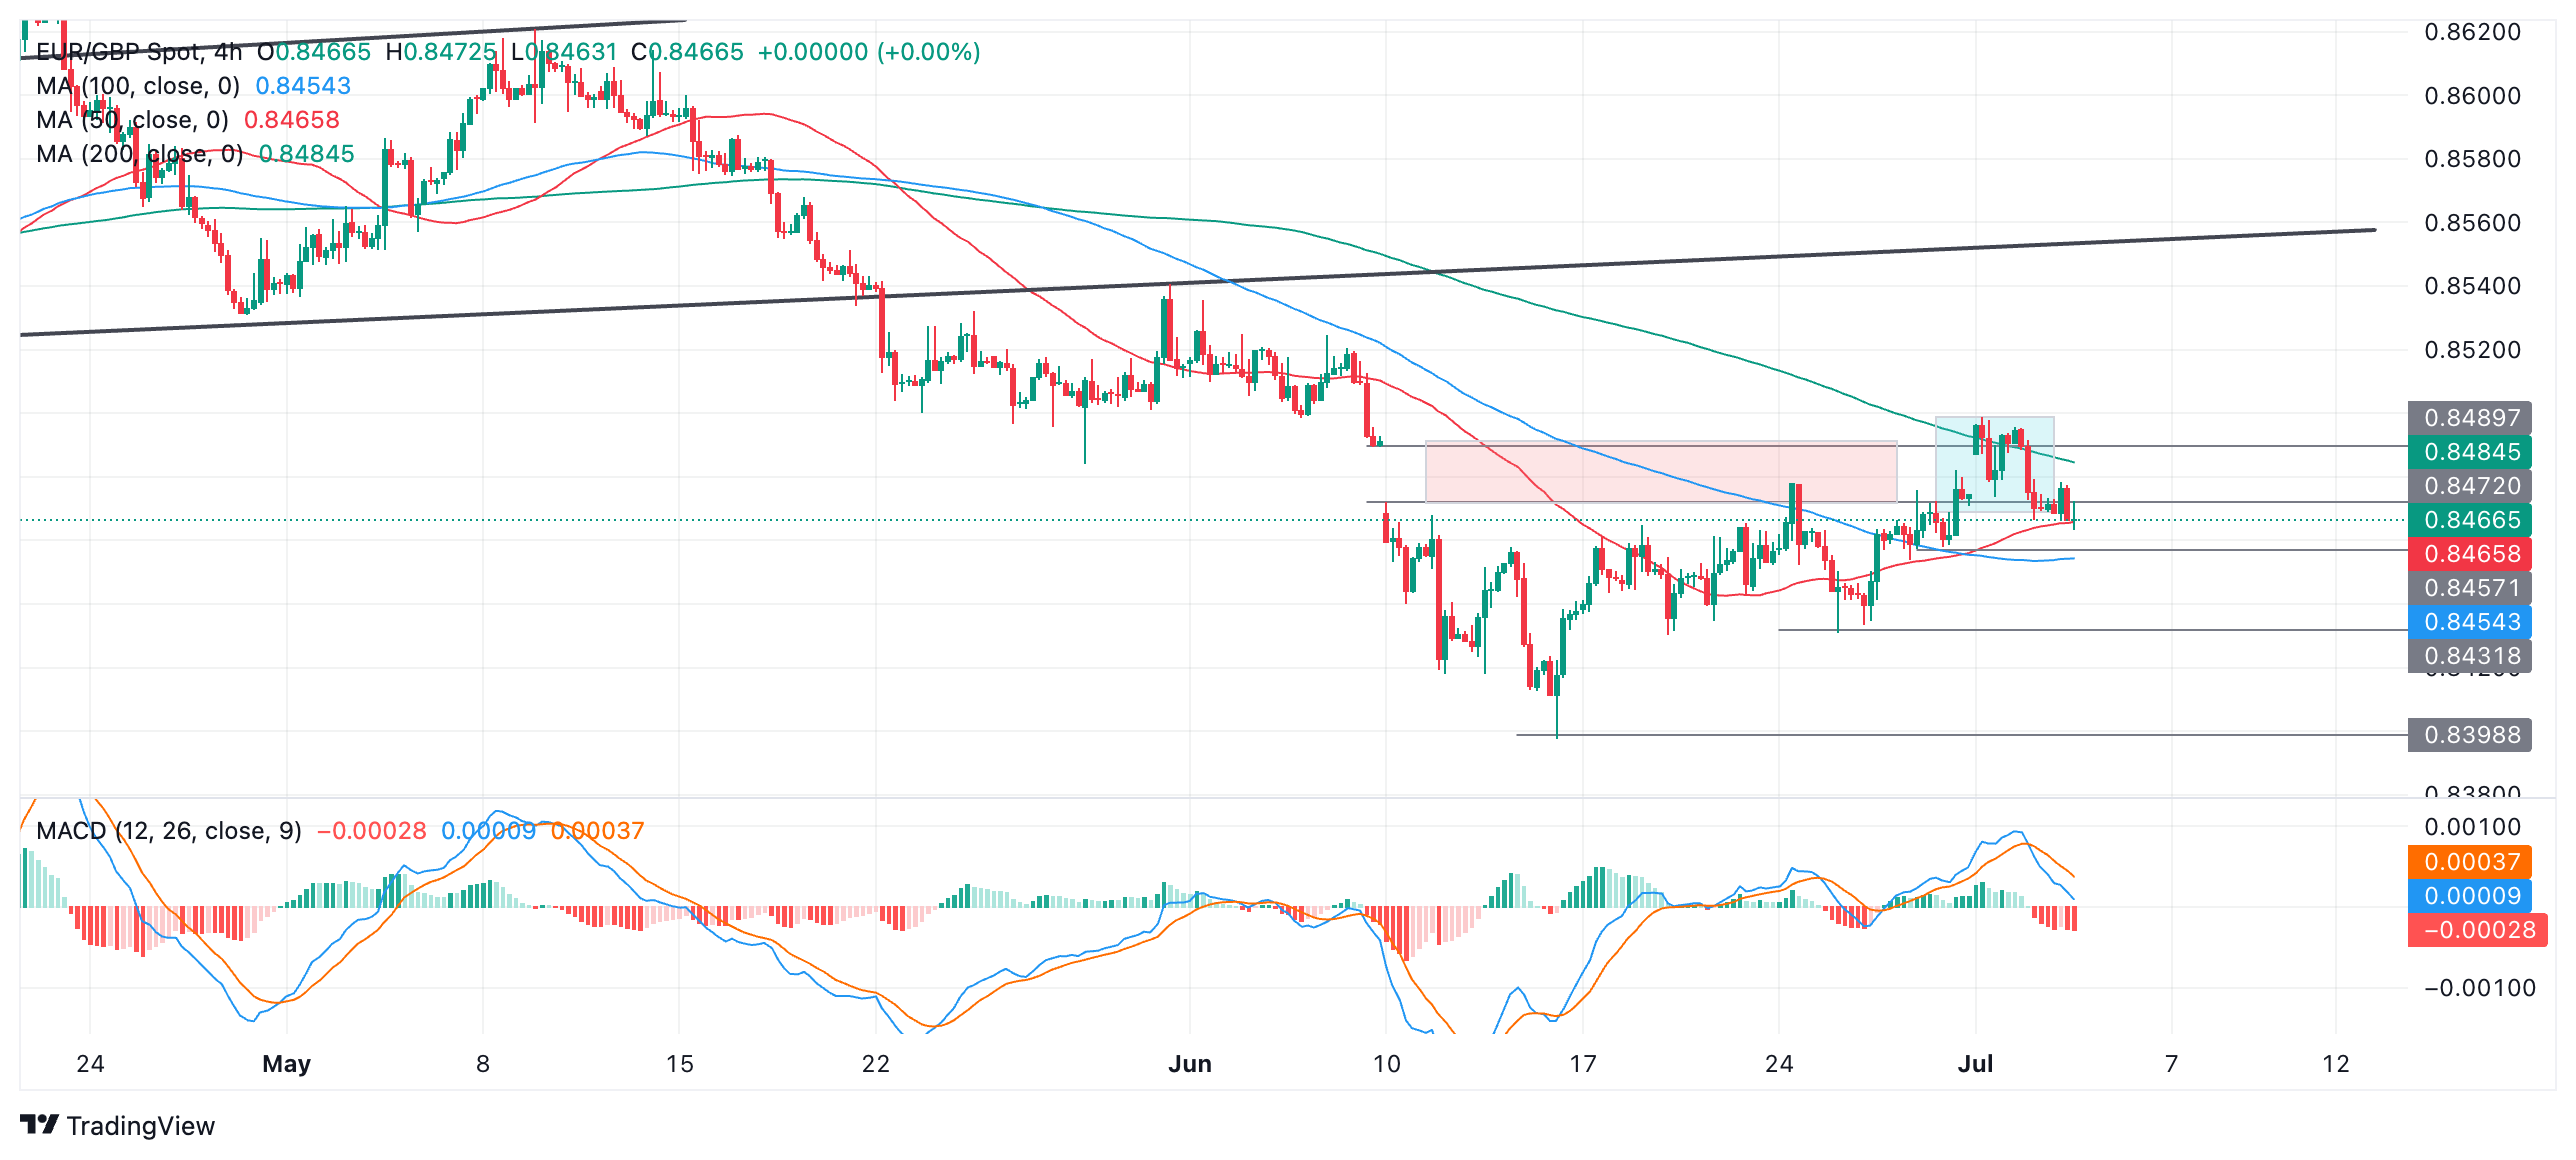
The Moving Average Convergence Divergence (MACD) on the 4-hour chart has crossed below its signal line during the reversal at the recent July 1 highs. This further indicates the correction may have run its course and is now turning lower.
It is still possible the pair could recover, however, and a break above 0.8499 (July 1) high would indicate a continuation of the correction higher, with the 50-day Simple Moving Average at 0.8517 providing the next resistance target to the upside.
Related Articles
$660B Capex Bill Triggers $900B Wipeout: Why Apple Shares Outperform Amazon and Google Despite AI Lag
Based on financial disclosures, the combined 2026 capital expenditure forecasts for Meta, Amazon, Google, and Microsoft are projected to reach $660 billion. This figure is not only significantly higher than the $410 billion forecast for 2025 and $245 billion for 2024, but even surpasses the GDP of I
Amazon Stock Predictions for 2026 to 2030: Will They Exceed Expectations and Achieve Major Long-Term Goals?
TradingKey - As we head into 2026, many investors are questioning where Amazon (AMZN) fits into the technology world.
A Crash After a Surge: Why Silver Lost 40% in a Week?
TradingKey - Spot silver (XAGUSD) prices continue to decline. Silver plunged 20% on Thursday, breaking below $71 per ounce, with the sell-off intensifying on Friday as prices fell further below $64. Compared to the all-time high set on January 29, silver prices have retraced more than 40%, wiping out nearly all gains accumulated over the previous month.
Is Bitcoin’s Four-Year Cycle Dead in 2026?
Is the Bitcoin 4-year cycle dead? After 2025 broke historical records with a red post-halving year, institutional analysts explore if the Bitcoin price has decoupled from the halving countdown. Analyze the impact of spot ETFs, global liquidity, and the roadmap to the 2028 halving in this 2026 market

