Bitcoin Price Forecast: BTC traders stay on the sidelines amid uncertainty over US-Iran peace plan

- Bitcoin price rises above $71,000 on Wednesday, holding the recovery of nearly 5% so far this week.
- Institutional demand remains indecisive, with US-listed ETFs alternating between inflows and outflows.
- BTC traders remain largely passive, with no clear directional bias amid uncertainty over the US-Iran ceasefire plan.
Bitcoin (BTC) price rises slightly, trading around $71,000 as of writing on Wednesday and holding its recovery earlier this week. Despite the mild recovery, mixed spot Exchange Traded Fund (ETF) flows signal growing indecision among institutional investors, who appear to be holding their bets amid increasing uncertainty over talks between the US and Iran over a potential ceasefire. BTC traders in the derivatives markets remain passive, with no clear directional bias, suggesting BTC could remain range-bound in the short term.
Uncertainty over the US-Iran peace plan remains high
Bitcoin price started on a positive note, rising more than 4% on Monday after reports emerged that US President Donald Trump signaled the possibility of peace talks with Iran, boosting risk sentiment.
Meanwhile, the news surrounding these peace talks remain unclear, with Iran’s military spokesperson mocking US attempts at a ceasefire deal, insisting that Americans were only negotiating with themselves, according to the Associated Press (AP) and the Guardian.
Iran’s Lt. Col. Ebrahim Zolfaghari said on state television that the US’s strategic power had turned into “strategic failure”. These comments from Tehran came after US President Donald Trump sent a 15-point settlement proposal to Iran.
While markets are cautious, either a positive or negative outcome of the peace negotiations are likely to trigger sharp moves in the Crypto King.
Institutional demand shows mixed sentiment
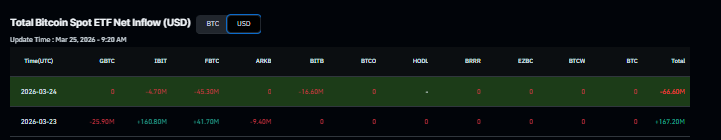
Institutional flows also reflect a mixed sentiment. CoinGlass data show that Bitcoin spot ETFs have seen alternating inflows and outflows this week, which began with positive flows of $167.20 million on Monday, followed by an outflow of $66.60 million on Tuesday. This highlights indecisiveness among institutional investors amid prevailing market uncertainty.
What to expect in the short term?
This short-term calm and sideways trading could persist as derivatives markets remain passive and without a clear directional bias. Unless a clear catalyst emerges from the ongoing war , BTC could remain range-bound.
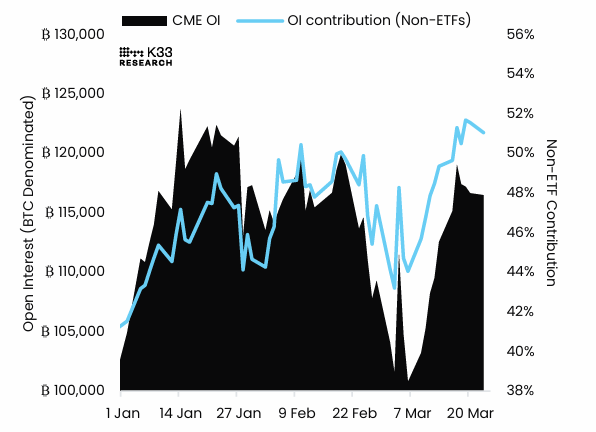
The K33 Research report on Tuesday highlights that the Open interest (OI) in Chicago Mercantile Exchange (CME) Bitcoin futures remained flat over the week.
“This reflects a passive investment pattern in BTC despite elevated intraweek volatility and ongoing global uncertainty, indicating that institutional investors continue to refrain from taking directional risk on either the long or short side”, said the K33 Research analyst.
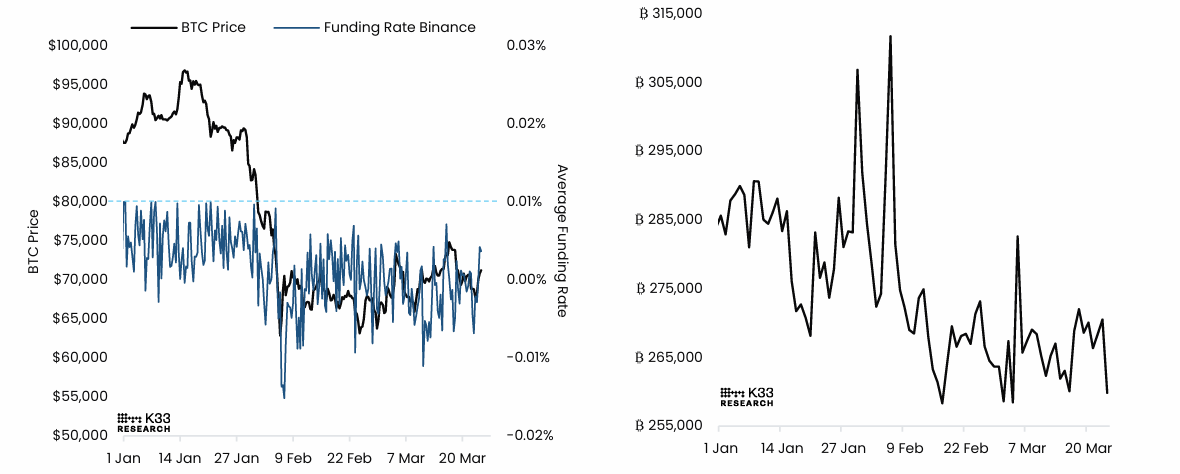
The report explained that the perpetual markets also remain largely unchanged from last week. As shown in the chart below, the OI has declined toward yearly lows, currently hovering below 260,000 BTC, as traders remain hesitant to add exposure.
“This reluctance is also evident in funding rates, which continue to signal limited appetite for long BTC exposure”, concluded the analyst.
Bitcoin Price Forecast: Momentum indicators show indecision
Bitcoin price trades around $71,000 on Wednesday, having recovered slightly so far this week. The near-term bias remains neutral, with a slight bullish tilt, as price holds above the mid-point of a channel near $69,000. However, BTC trades well below the 50-day and 100-day Exponential Moving Averages clustered around $72,160 and $78,000, respectively, so the broader trend remains under pressure despite the recent rebound inside the channel.
The Relative Strength Index (RSI) on the daily chart at 52 sits just above its midline, hinting at stabilizing momentum rather than a trending move. The Moving Average Convergence Divergence (MACD) indicator has turned back into positive territory, with the MACD line edging above its signal line and a modestly positive histogram, suggesting fading bearish pressure but not yet a decisive upside breakout.
Initial support emerges near $69,000, the midpoint of the channel, followed by a deeper level around $65,900 that aligns with the lower part of the consolidation range. A break below this area would trigger deeper losses toward $60,000, a key psychological level.
On the upside, immediate resistance lies at $72,160, the 50-day EMA, followed by $72,600, the former channel top. A daily close above this zone would strengthen the bullish case toward the March 17 high of $76,000.
-1774433828121-1774433828122.png)
(The technical analysis of this story was written with the help of an AI tool.)
Bitcoin, altcoins, stablecoins FAQs
Bitcoin is the largest cryptocurrency by market capitalization, a virtual currency designed to serve as money. This form of payment cannot be controlled by any one person, group, or entity, which eliminates the need for third-party participation during financial transactions.
Altcoins are any cryptocurrency apart from Bitcoin, but some also regard Ethereum as a non-altcoin because it is from these two cryptocurrencies that forking happens. If this is true, then Litecoin is the first altcoin, forked from the Bitcoin protocol and, therefore, an “improved” version of it.
Stablecoins are cryptocurrencies designed to have a stable price, with their value backed by a reserve of the asset it represents. To achieve this, the value of any one stablecoin is pegged to a commodity or financial instrument, such as the US Dollar (USD), with its supply regulated by an algorithm or demand. The main goal of stablecoins is to provide an on/off-ramp for investors willing to trade and invest in cryptocurrencies. Stablecoins also allow investors to store value since cryptocurrencies, in general, are subject to volatility.
Bitcoin dominance is the ratio of Bitcoin's market capitalization to the total market capitalization of all cryptocurrencies combined. It provides a clear picture of Bitcoin’s interest among investors. A high BTC dominance typically happens before and during a bull run, in which investors resort to investing in relatively stable and high market capitalization cryptocurrency like Bitcoin. A drop in BTC dominance usually means that investors are moving their capital and/or profits to altcoins in a quest for higher returns, which usually triggers an explosion of altcoin rallies.