Bitcoin Price Forecast: BTC steadies near $70,000 ahead of US CPI data

- Bitcoin price trades around $70,000 on Wednesday, rebounding more than 5% earlier this week.
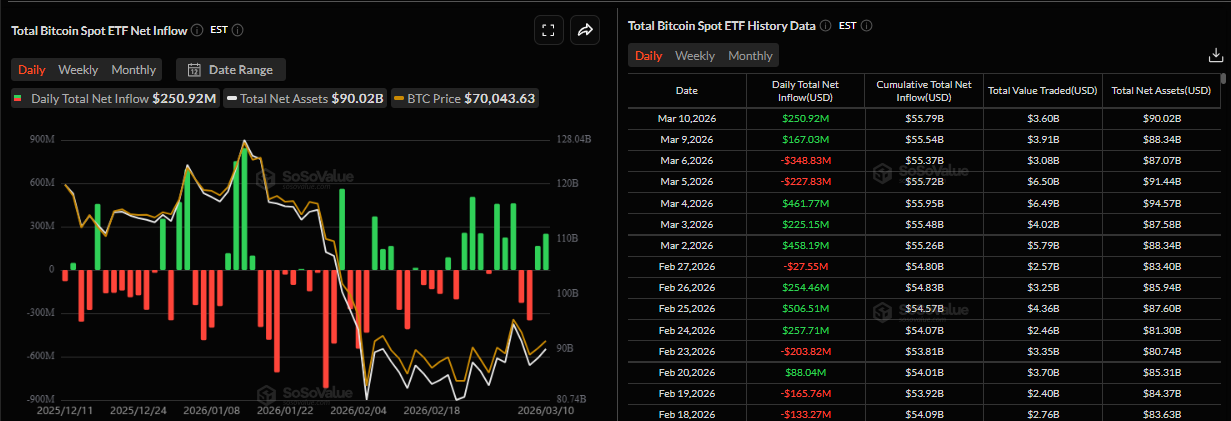
- US-listed spot ETFs record an inflow of over $250 million on Tuesday, a second consecutive day of flows so far this week.
- Market participants await the US CPI data on Wednesday, which could trigger volatility for riskier assets such as BTC.
Bitcoin (BTC) price trades around $70,000 as of Wednesday, trimming some of the 5% gains seen earlier in the week. Institutional demand shows signs of strength, as spot Exchange Traded Funds (ETFs) recorded a second consecutive day of inflows so far this week. Traders eye the upcoming US Consumer Price Index (CPI) data release for clues about the Federal Reserve's rate path, which could, in turn, bring some volatility to Bitcoin.
US CPI could trigger volatility in risky assets
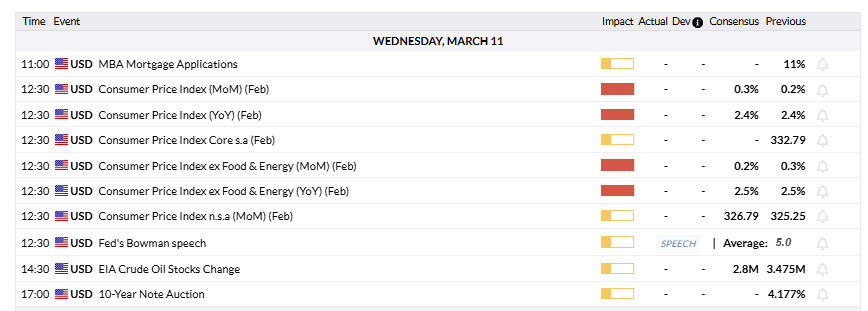
Bitcoin traders await the key US CPI data for February, scheduled for release at 12:30 GMT as shown in the chart below. The report is expected to show a stabilization in inflation, still above the Federal Reserve’s (Fed) 2% target. The monthly CPI is forecast to rise 0.3%, following the 0.2% increase recorded in January, while the annualized reading is seen holding steady at 2.4%. Core CPI figures, which exclude volatile food and energy prices, are expected to come in at 0.2% and 2.5%, on a monthly and yearly basis, respectively.
Generally, the inflation data shapes expectations for upcoming Fed interest rate cuts, potentially triggering volatility in the Crypto King. However, the market reaction to the February CPI release may remain relatively muted, as the numbers are unlikely to fully capture the recent surge in Oil prices driven by war in the Middle East. Despite this, any surprise or jump from the expected data could still spark short-term volatility across riskier assets such as BTC.
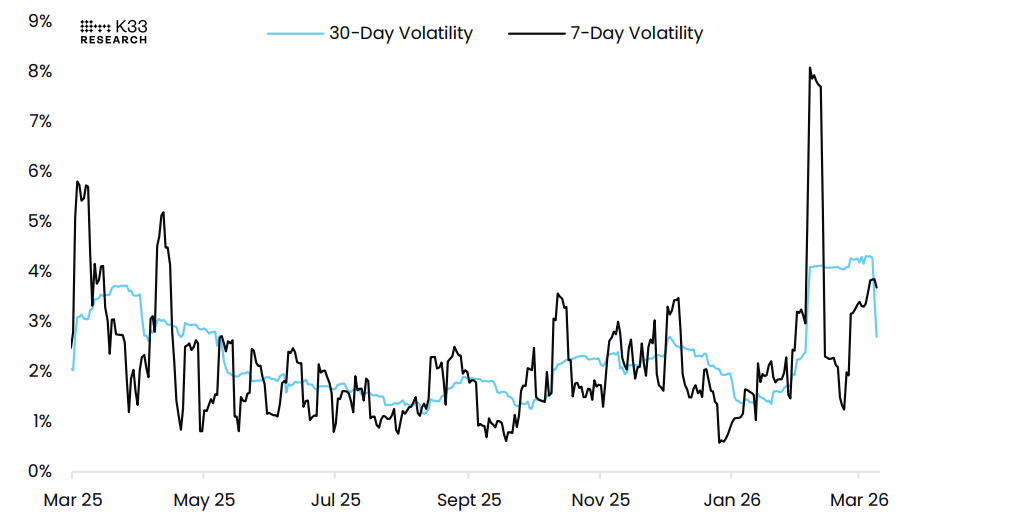
According to the K33 report, the recent market behavior also suggests that Bitcoin is trading in an elevated volatility environment. While BTC posted modest gains over the past week, its daily return profile indicates consolidation within an unusually high volatility regime, with 7-day volatility approaching 4%, levels comparable to the spikes seen during the October and December volatility surges.
Institutional demand shows some signs of optimism
Institutional demand has remained strong so far this week. According to SoSoValue data, spot Bitcoin ETFs recorded inflows of $250.92 million on Tuesday, following $167.03 million the previous day. If these inflows continue and intensify, BTC could see a further recovery in the upcoming days.
Why is Bitcoin showing signs of strength?
Bitcoin’s price remained resilient despite rising tensions between the US and Iran. The Crypto King gained over 5% so far this week after US President Donald Trump said on Monday that the war with Iran could end “very soon”, which slightly boosted investors' confidence.
Meanwhile, the concerns over global inflation driven by rising Oil prices amid the Middle East conflict have eased slightly, as Crude prices continue to slip following a report that the International Energy Agency (IEA) is considering the largest release of Oil reserves in its history to bring down prices. The move has improved overall risk sentiment, with BTC holding steady above $70,000 as of writing on Wednesday.
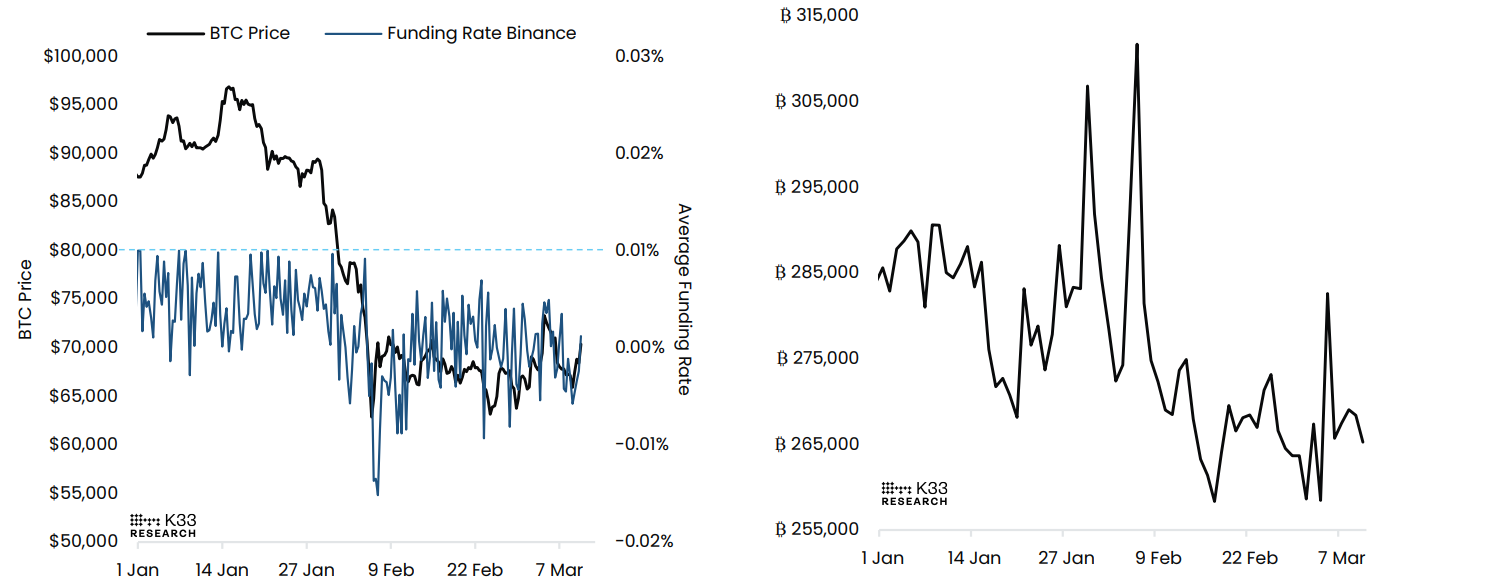
The K33 Research report released on Tuesday noted that while Bitcoin has shown relatively resilient performance following the escalation of tensions involving Iran, derivatives markets remain defensive. The chart below shows that, over the past week, annualized funding rates (left chart) averaged around -0.78%, dropping to a four-week low of -3.8% on March 9, signaling traders’ reluctance to add aggressive long exposure.
The report further explained that leveraged positioning has been highly volatile, with notional Open Interest (OI) jumping by 24,154 BTC on March 5, the largest daily increase since April 2023, before quickly reversing.
“Rapid shifts in OI show that the current derivatives regime is prone to abrupt changes, with liquidation risks able to emerge quickly and requiring close monitoring from active traders,” reported the K33 Research analyst.
Bitcoin Price Forecast: BTC bulls aiming for a channel breakout
Bitcoin price is trading just below $70,000 as of writing on Wednesday, after rebounding by over 5% in the previous two days. The near-term bias turns mildly bullish as price rebounds off the lower boundary of the channel near $65,900 and pushes back toward the mid-section of the structure.
The Relative Strength Index (RSI) on the daily chart is at 50, hovering just above its midline, aligning with recovering bullish pressure rather than a fully established uptrend. The Moving Average Convergence Divergence (MACD) histogram rises on a bullish crossover, signalling strengthening upside momentum despite the broader sideways trend.
Initial support emerges at $68,400, with a deeper cushion at $66,900 ahead of the channel floor around $65,900, where prior demand and the lower boundary converge. A sustained hold above these levels would keep the rebound in play, with the focus on resistance at $70,900, followed by the recent swing high near $72,700, which coincides with the channel top and defines the key cap for any extension higher.
A daily close above $72,700 would break the channel pattern and open the way toward the 50-day Exponential Moving Average (EMA) clustered in the low-$73,000s.
-1773226213648-1773226213649.png)
(The technical analysis of this story was written with the help of an AI tool.)
Bitcoin, altcoins, stablecoins FAQs
Bitcoin is the largest cryptocurrency by market capitalization, a virtual currency designed to serve as money. This form of payment cannot be controlled by any one person, group, or entity, which eliminates the need for third-party participation during financial transactions.
Altcoins are any cryptocurrency apart from Bitcoin, but some also regard Ethereum as a non-altcoin because it is from these two cryptocurrencies that forking happens. If this is true, then Litecoin is the first altcoin, forked from the Bitcoin protocol and, therefore, an “improved” version of it.
Stablecoins are cryptocurrencies designed to have a stable price, with their value backed by a reserve of the asset it represents. To achieve this, the value of any one stablecoin is pegged to a commodity or financial instrument, such as the US Dollar (USD), with its supply regulated by an algorithm or demand. The main goal of stablecoins is to provide an on/off-ramp for investors willing to trade and invest in cryptocurrencies. Stablecoins also allow investors to store value since cryptocurrencies, in general, are subject to volatility.
Bitcoin dominance is the ratio of Bitcoin's market capitalization to the total market capitalization of all cryptocurrencies combined. It provides a clear picture of Bitcoin’s interest among investors. A high BTC dominance typically happens before and during a bull run, in which investors resort to investing in relatively stable and high market capitalization cryptocurrency like Bitcoin. A drop in BTC dominance usually means that investors are moving their capital and/or profits to altcoins in a quest for higher returns, which usually triggers an explosion of altcoin rallies.
Related Articles
Ahead of CPI Release, Credit Crisis Panic Haunts Markets, Wall Street Eyes How Inflation Data Will Impact US Stocks
TradingKey - At 8:30 AM ET on Wednesday, the U.S. Bureau of Labor Statistics will release the February Consumer Price Index (CPI) report, which traders view as setting the tone for investment direction.
Trump Wants TACO? The Script for an Iran War May No Longer Be His to Write
TradingKey - As the US-Israel-Iran conflict enters its second week, new developments have emerged in the situation. On March 9 local time, U.S. President Trump sent a clear signal during a press conference, stating that military operations against Iran would end "soon" but would not be completed within this week. This statement has been interpreted by observers as a direct signal that the U.S. is seeking a "graceful exit." In response to the de-escalatory signals from the U.S., Iran’s stance remains defiant.
Bitcoin Price Analysis: BTC Eyes $72K Breakout Amid Mideast Supply Shocks and Short Squeeze Risk
BTC faces a critical $72K resistance amid Middle East supply shocks and a $4.3B short squeeze risk. Explore the latest btc price trends, institutional ETF outflows, and the impact of the upcoming "Clarity Act" on bitcoin’s market forecast.
Micron vs. Samsung vs. SK Hynix: Is MU Stock the Best Memory Stock for 2026?
TradingKey - Relying on strong AI demand, more memory per system, and sluggish supply response, 2026 will be the memory cycle. Micron Technology (MU) is now in an excellent competitive position today with HBM3E and looking to ramp HBM4E into Nvidia’s Vera Rubin platforms in the second half of 2026.