Crypto Today: Bitcoin steadies around $70,000, Ethereum and XRP remain under pressure

- Bitcoin hovers around $70,000, up near 15% from last week's low of $60,000 despite low retail demand.
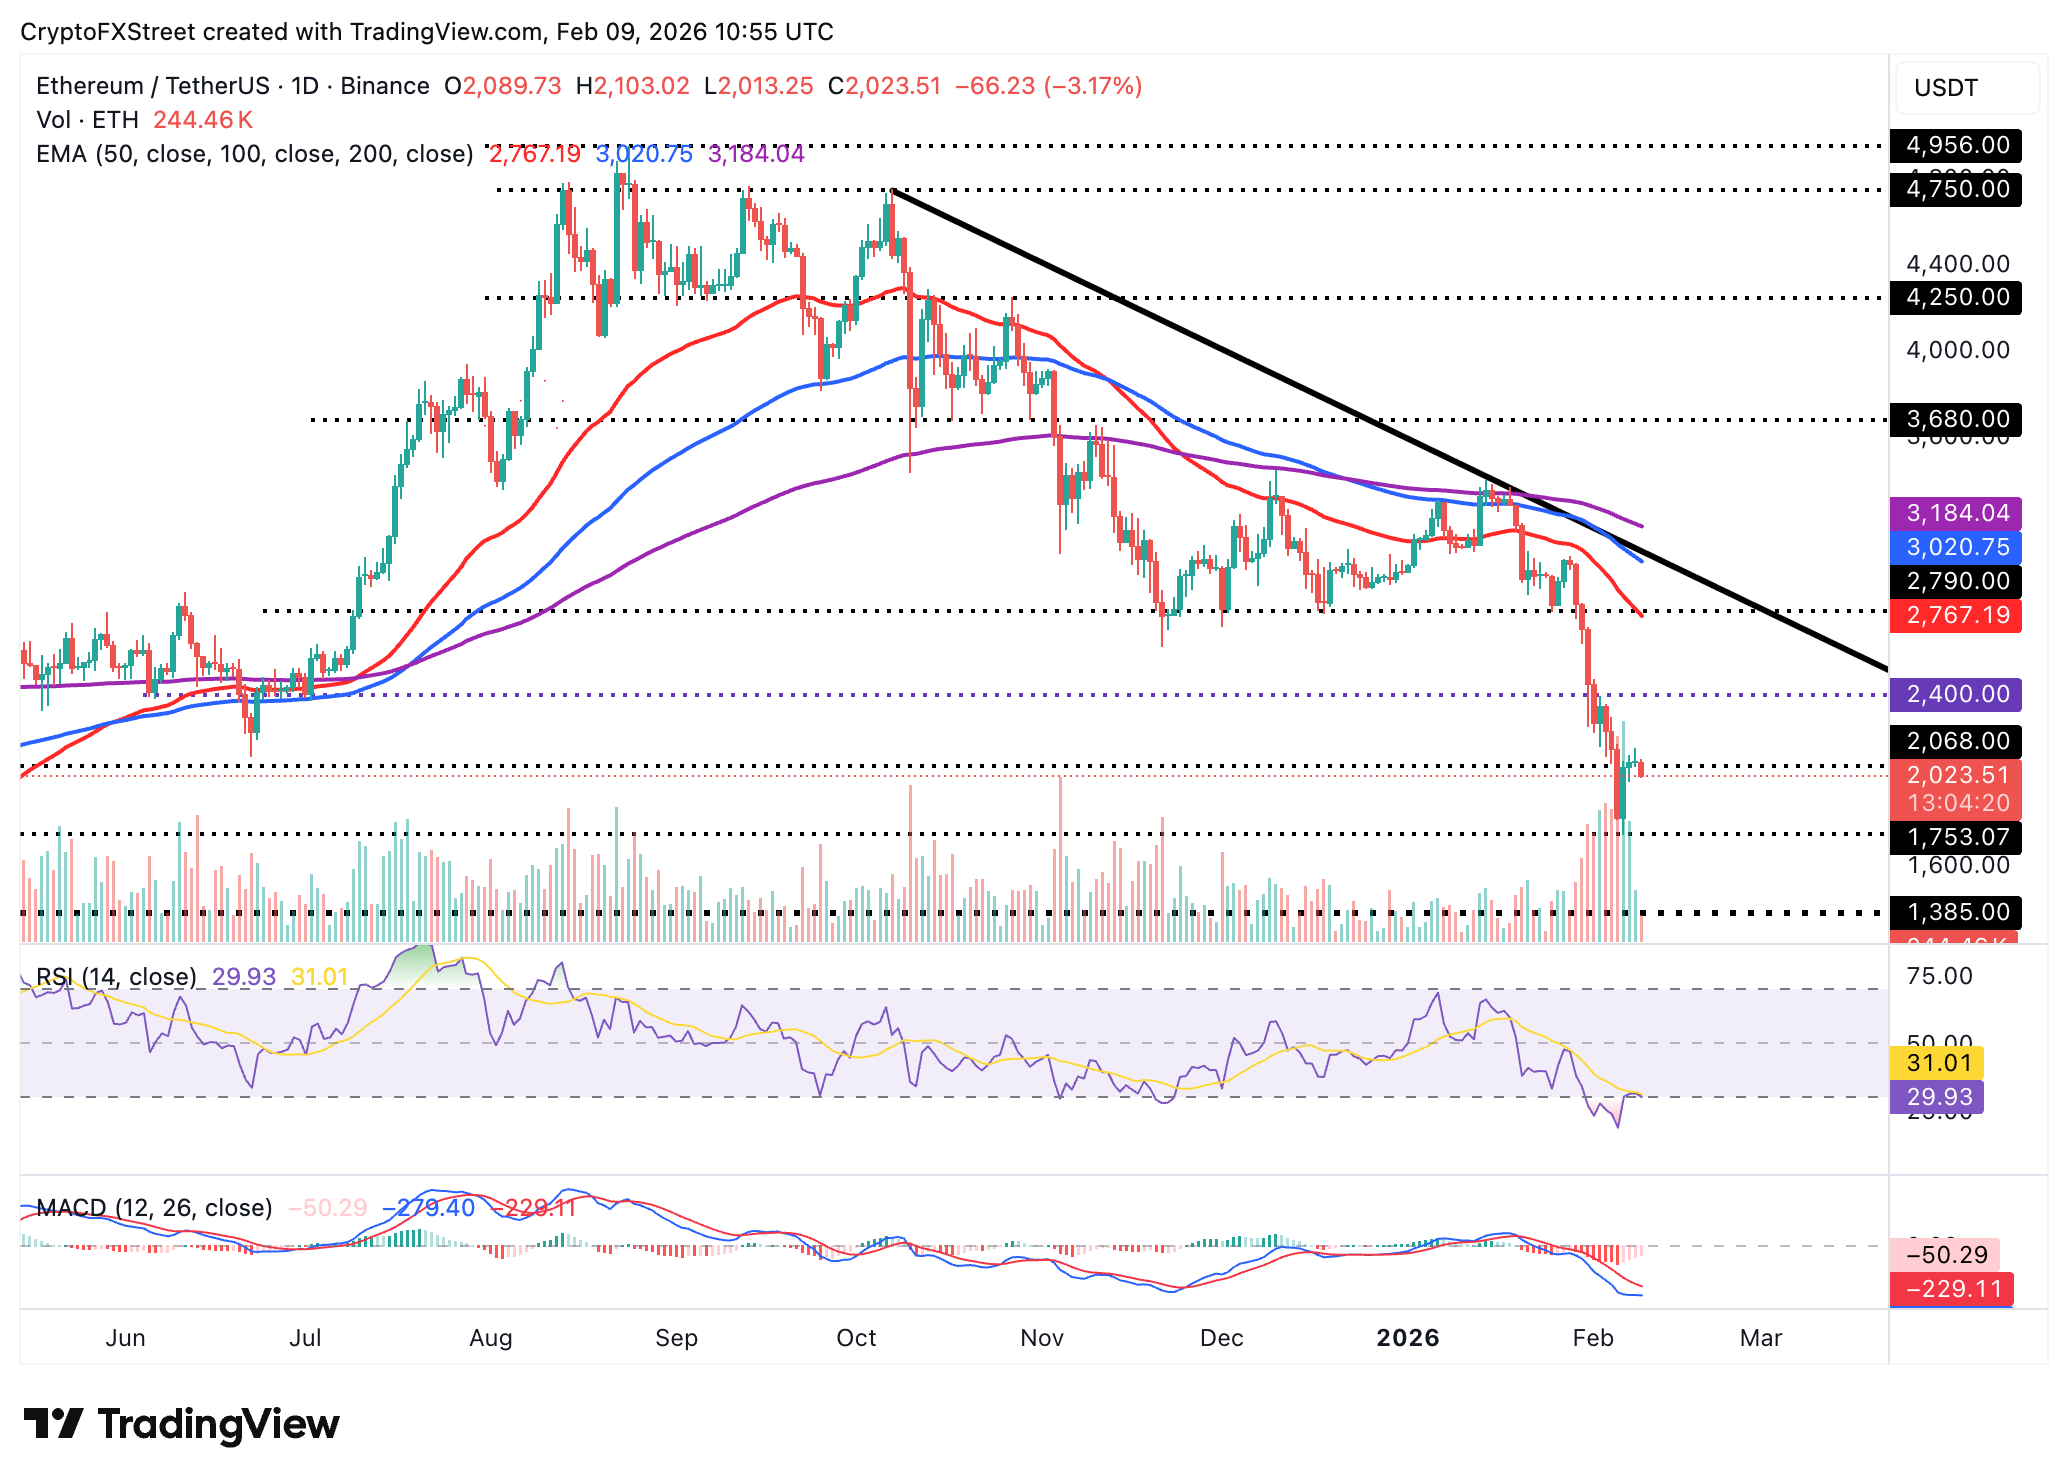
- Ethereum delicately holds $2,000 support as weak technicals weigh amid declining futures Open Interest.
- XRP seeks support above $1.40 after facing rejection at $1.54 during the previous week's sharp rebound.
Bitcoin (BTC) is trading near $70,000 any the time of writing on Monday, as prices in the broader cryptocurrency market consolidate in the wake of last week's turbulence.
Despite Bitcoin's price rising from last week's low of $60,000, retail interest remains low, suggesting caution among investors.
Altcoins, including Ethereum (ETH) and Ripple (XRP), are trading under pressure, with the leading smart contracts token, ETH, holding support at $2,000 and the remittance token, XRP, staying above $1.40.
Assessing BTC, ETH and XRP outlook amid low retail activity
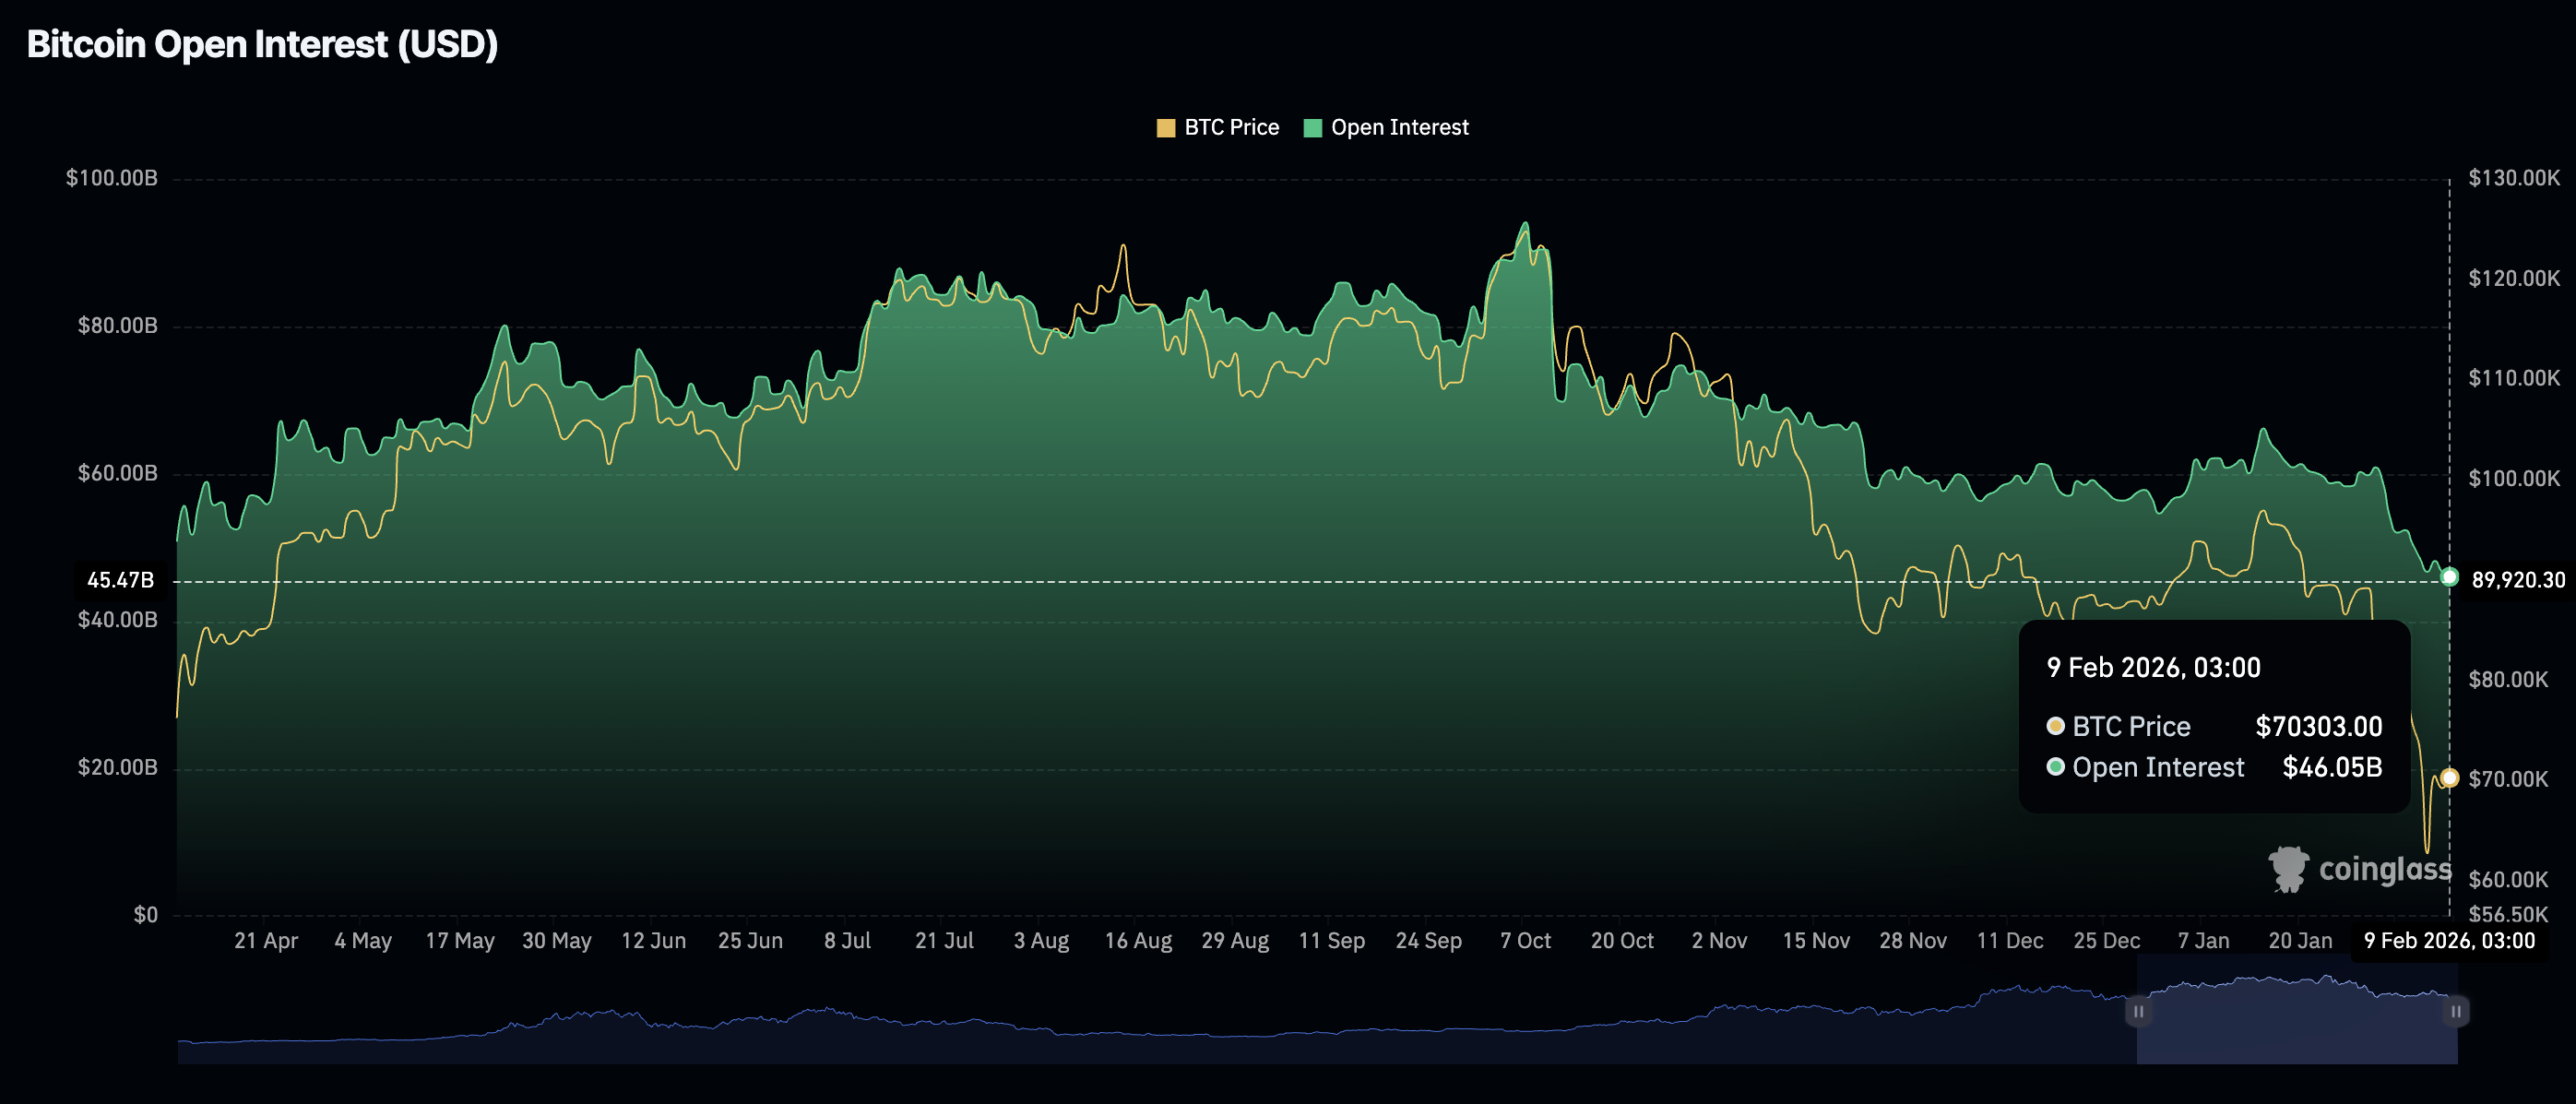
Bitcoin's knee-jerk recovery from $60,000 largely hinged on market participants' reaction to an oversold market, with little to muted retail interest supporting the upswing. According to CoinGlass data, futures Open Interest (OI) has declined to $46 billion on Monday, from $46.7 billion the previous day.
OI tracks the notional value of outstanding futures contracts, and it is steadily extending its downtrend from the $48 billion level recorded on Saturday. Retail interest plays a key role in supporting a sustainable bullish outlook; hence, OI should steadily rise, boosting the odds of a Bitcoin rally toward $80,000.
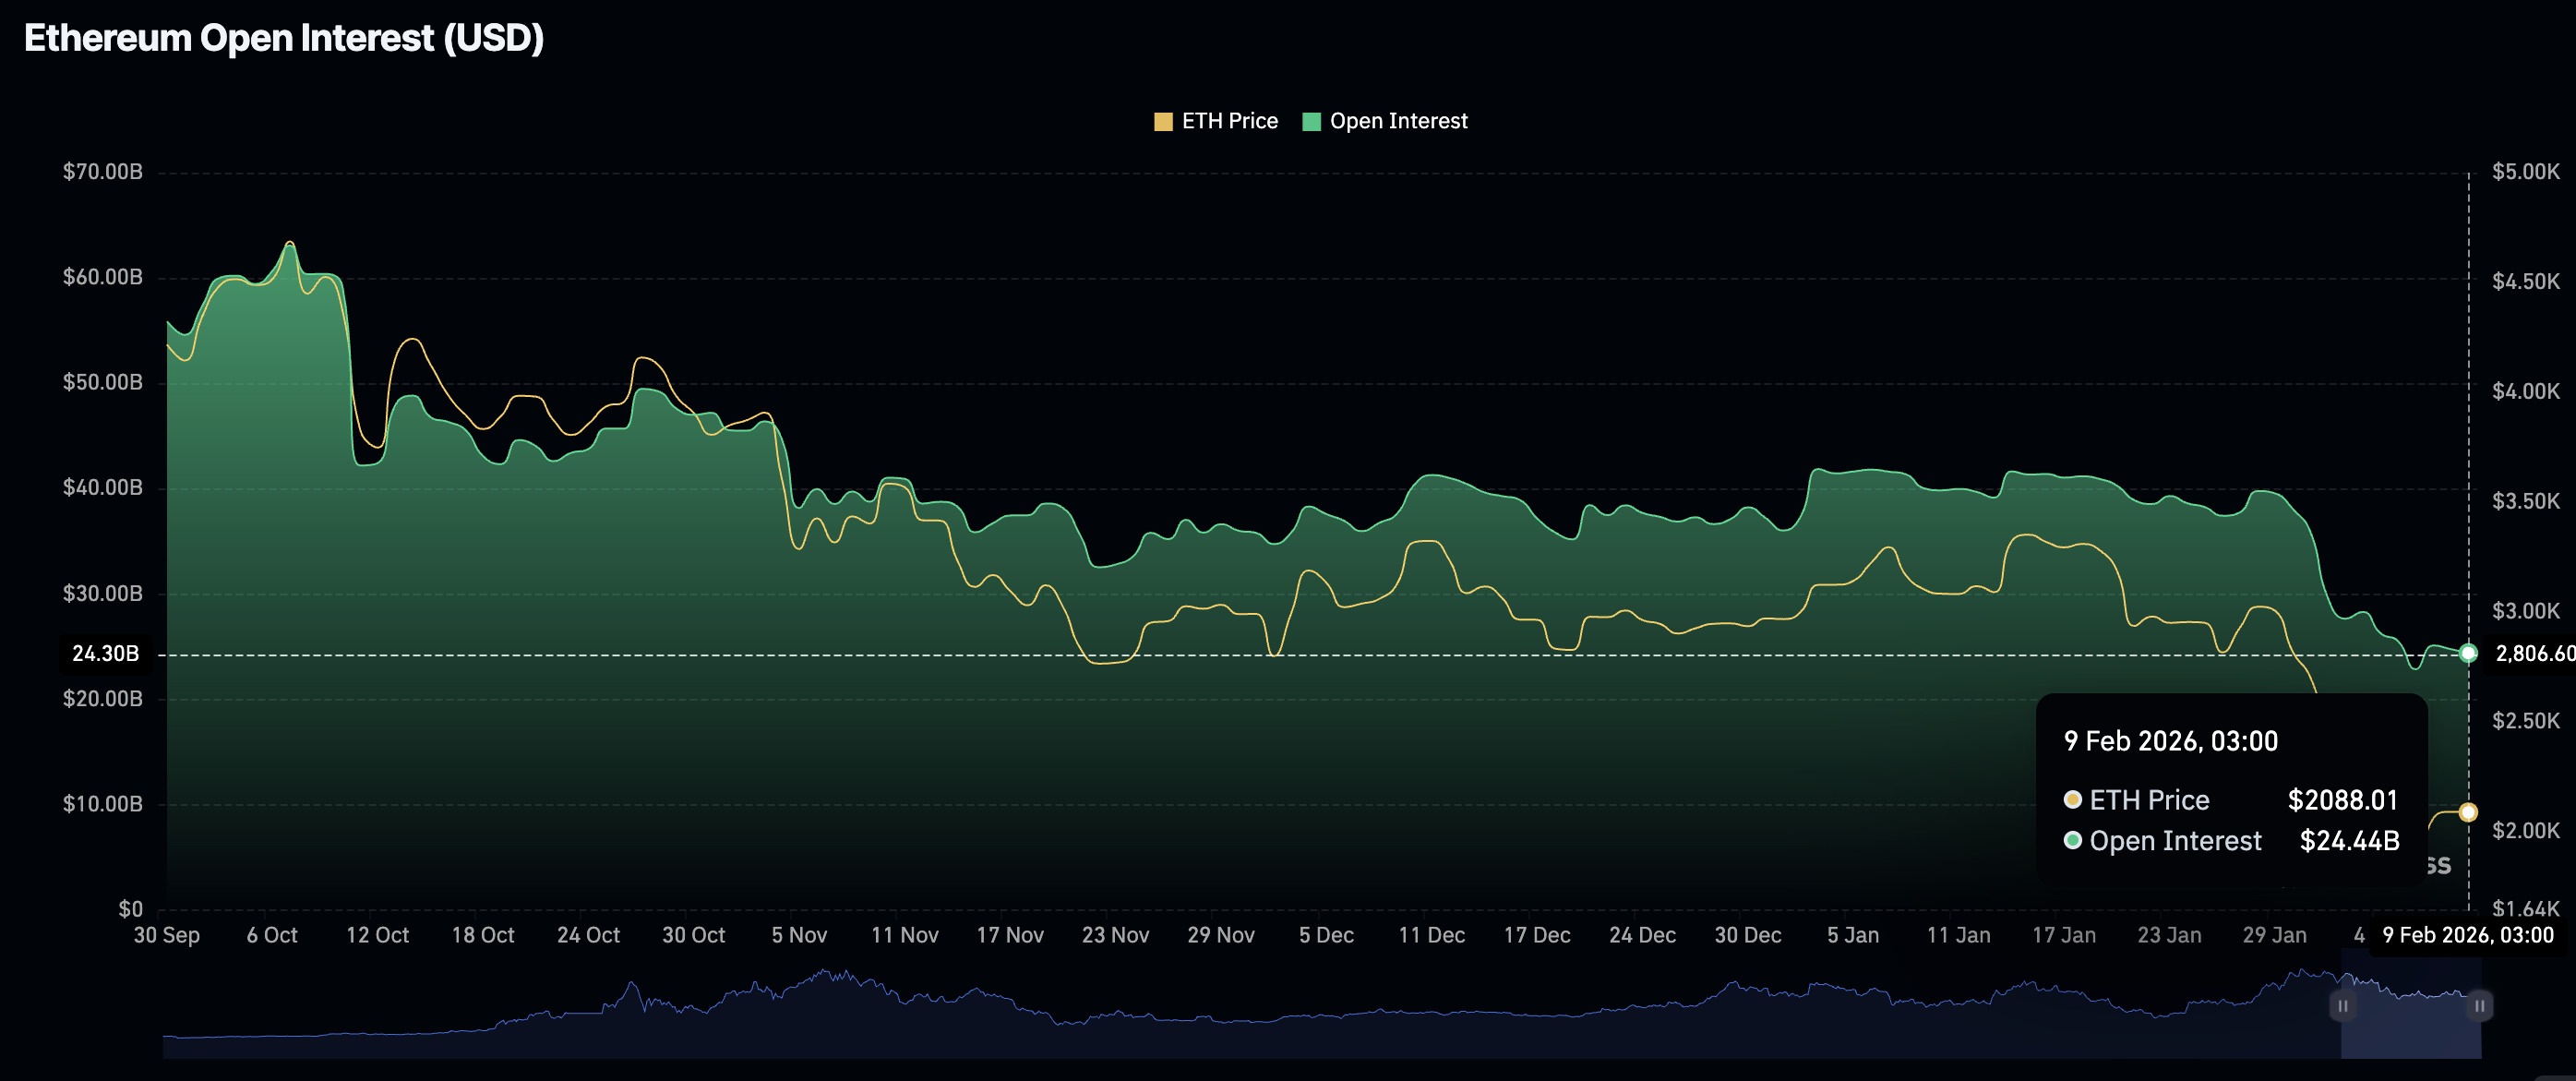
Ethereum is similarly facing low retail interest, with futures OI averaging $24.4 billion on Monday, down from $24.8 billion on Sunday. Amid Ethereum's rebound from the previous week's low of $1,748, OI increased to $25.2 billion. However, risk-off appetite quickly snuffed out the momentum, weighing down on Ethereum as derivatives traders closed open positions. A further decline in OI would make it difficult to keep Ethereum above $2,000 and possibly open the door to an extended downtrend toward April's low of $1,385.
Meanwhile, the XRP derivatives market remains weak, as reflected by futures OI falling to $2.47 billion on Monday, from $2.53 billion on the previous day. A minor recovery on Saturday had elevated the OI to $2.63 billion. Still, growing uncertainty in the broader crypto market, risk-off sentiment, and profit-taking, retail interest remains on the back foot.
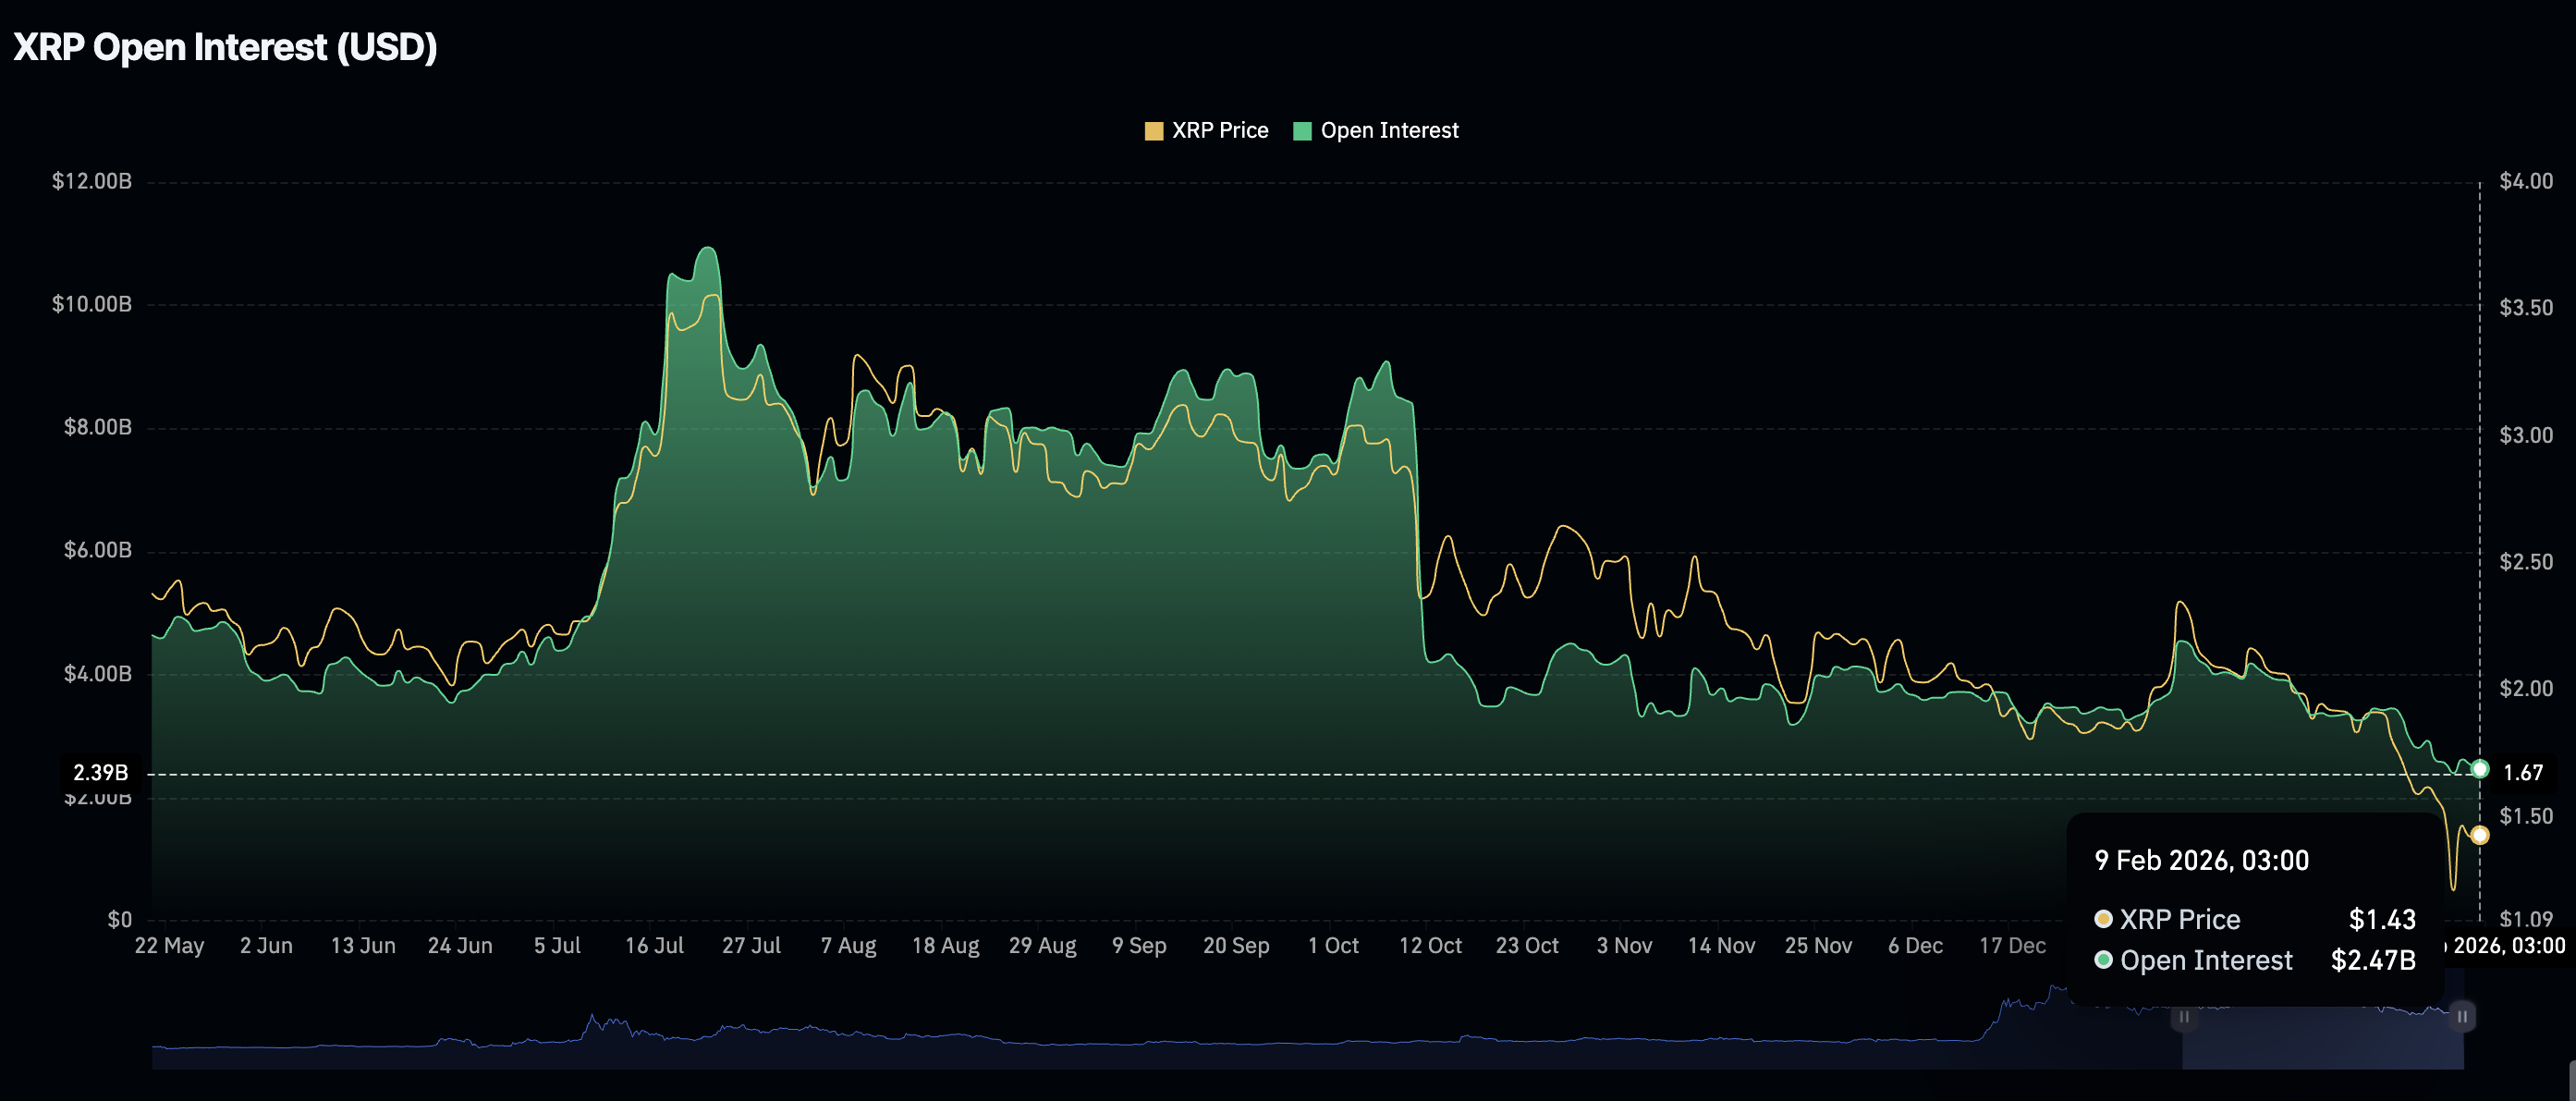
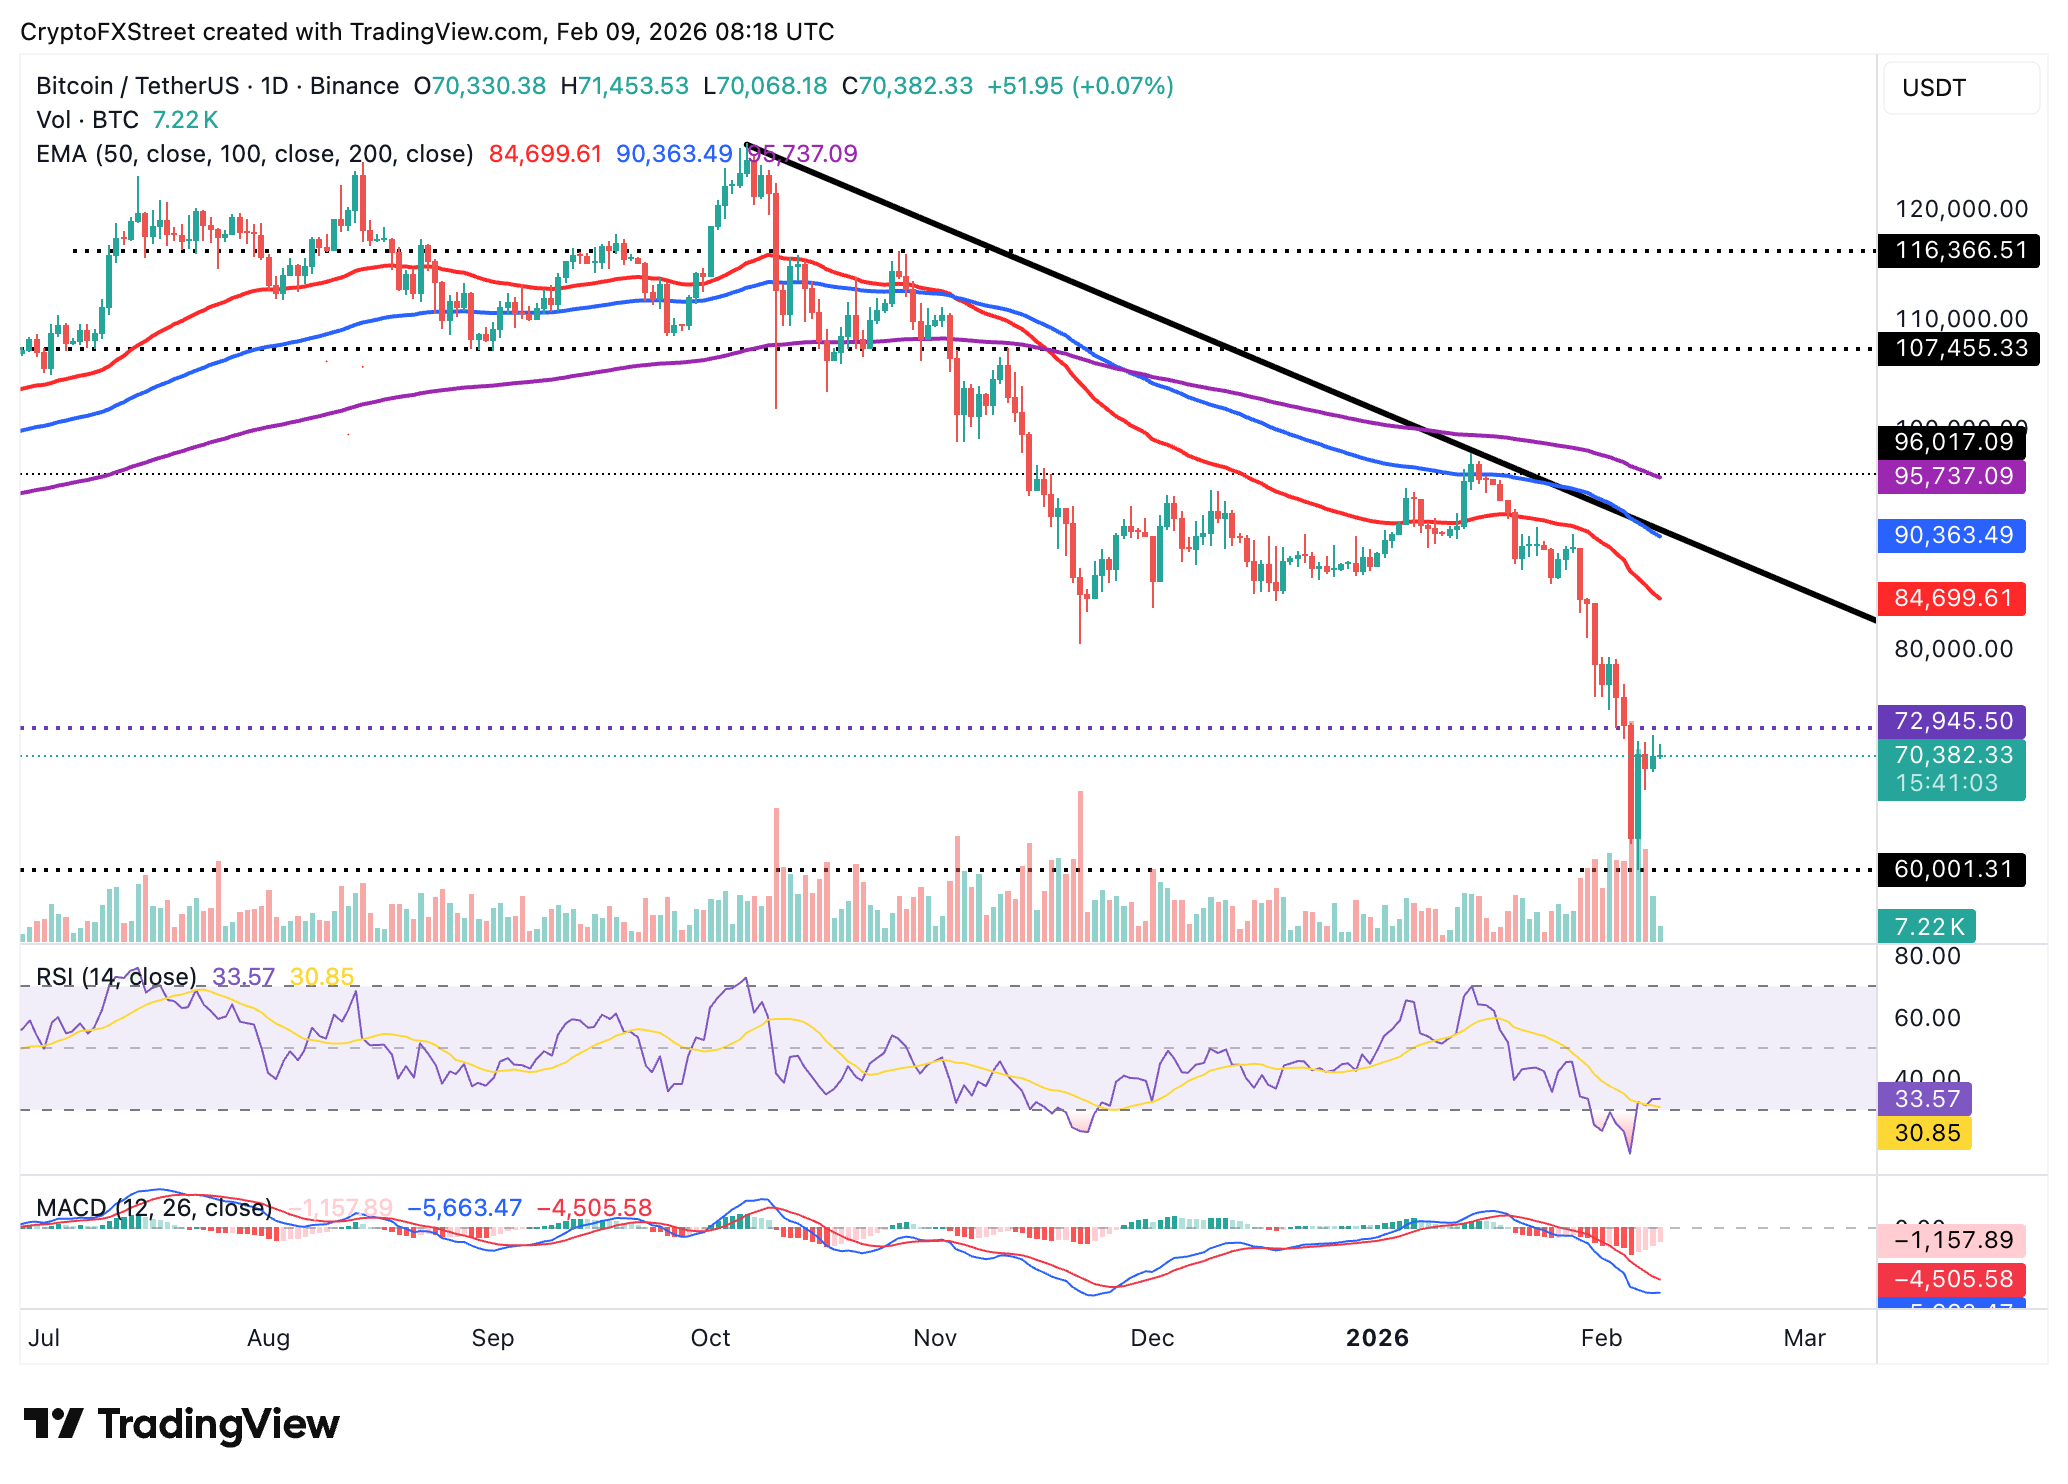
Chart of the day: Bitcoin at risk of trimming gains
Bitcoin is poised to resume its downtrend amid intensifying headwinds and risk-off sentiment. The downward-facing 50-day Exponential Moving Average (EMA) at $84,699, the 100-day EMA at $90,363, and the 200-day EMA at $95,737 are weighing on BTC's price, with bearish momentum likely to surge in the near term.
The Moving Average Convergence Divergence (MACD) indicator remains below the signal line on the daily chart, reinforcing the overall bearish trend. Although the Relative Strength Index (RSI) sits above oversold territory on the same chart, it exhibits weakness, which could accelerate the downtrend toward $60,000.
A daily close above $70,000 is required to uphold the short-term bullish outlook, with near-term targets at Sunday's high of $72,271 and Thursday's high at $73,341.
Altcoins technical outlook: Ethereum, XRP hold key support
Ethereum remains under pressure despite rising above $2,000 after falling to $1,753 on Friday. The RSI at 30 on the daily chart suggests that bears still have the upper hand, while the MACD indicator remains below its signal line, suggesting investors should reduce their risk exposure.
A daily close above the immediate $2,000 level may uphold the ongoing stability in Ethereum price, attracting investors to lean into risk ahead of the next recovery leg targeting the supply zone at $2,400. Conversely, Ethereum is not out of the woods yet, and a sell-off may ensue, considering the weak derivatives market as discussed above. Therefore, traders should not lose sight of the support established at $1,753.
As for XRP, recovery has hit a snag, drawing attention toward a weakening retail market and a technical structure that may not be robust enough to sustain an uptrend. The remittance token holds support at $1.40 but remains well below the 50-day EMA at $1.83, the 200-day EMA at $2.01 and the 200-day EMA at $2.19. All three moving averages are declining and supporting an extended bearish outlook.
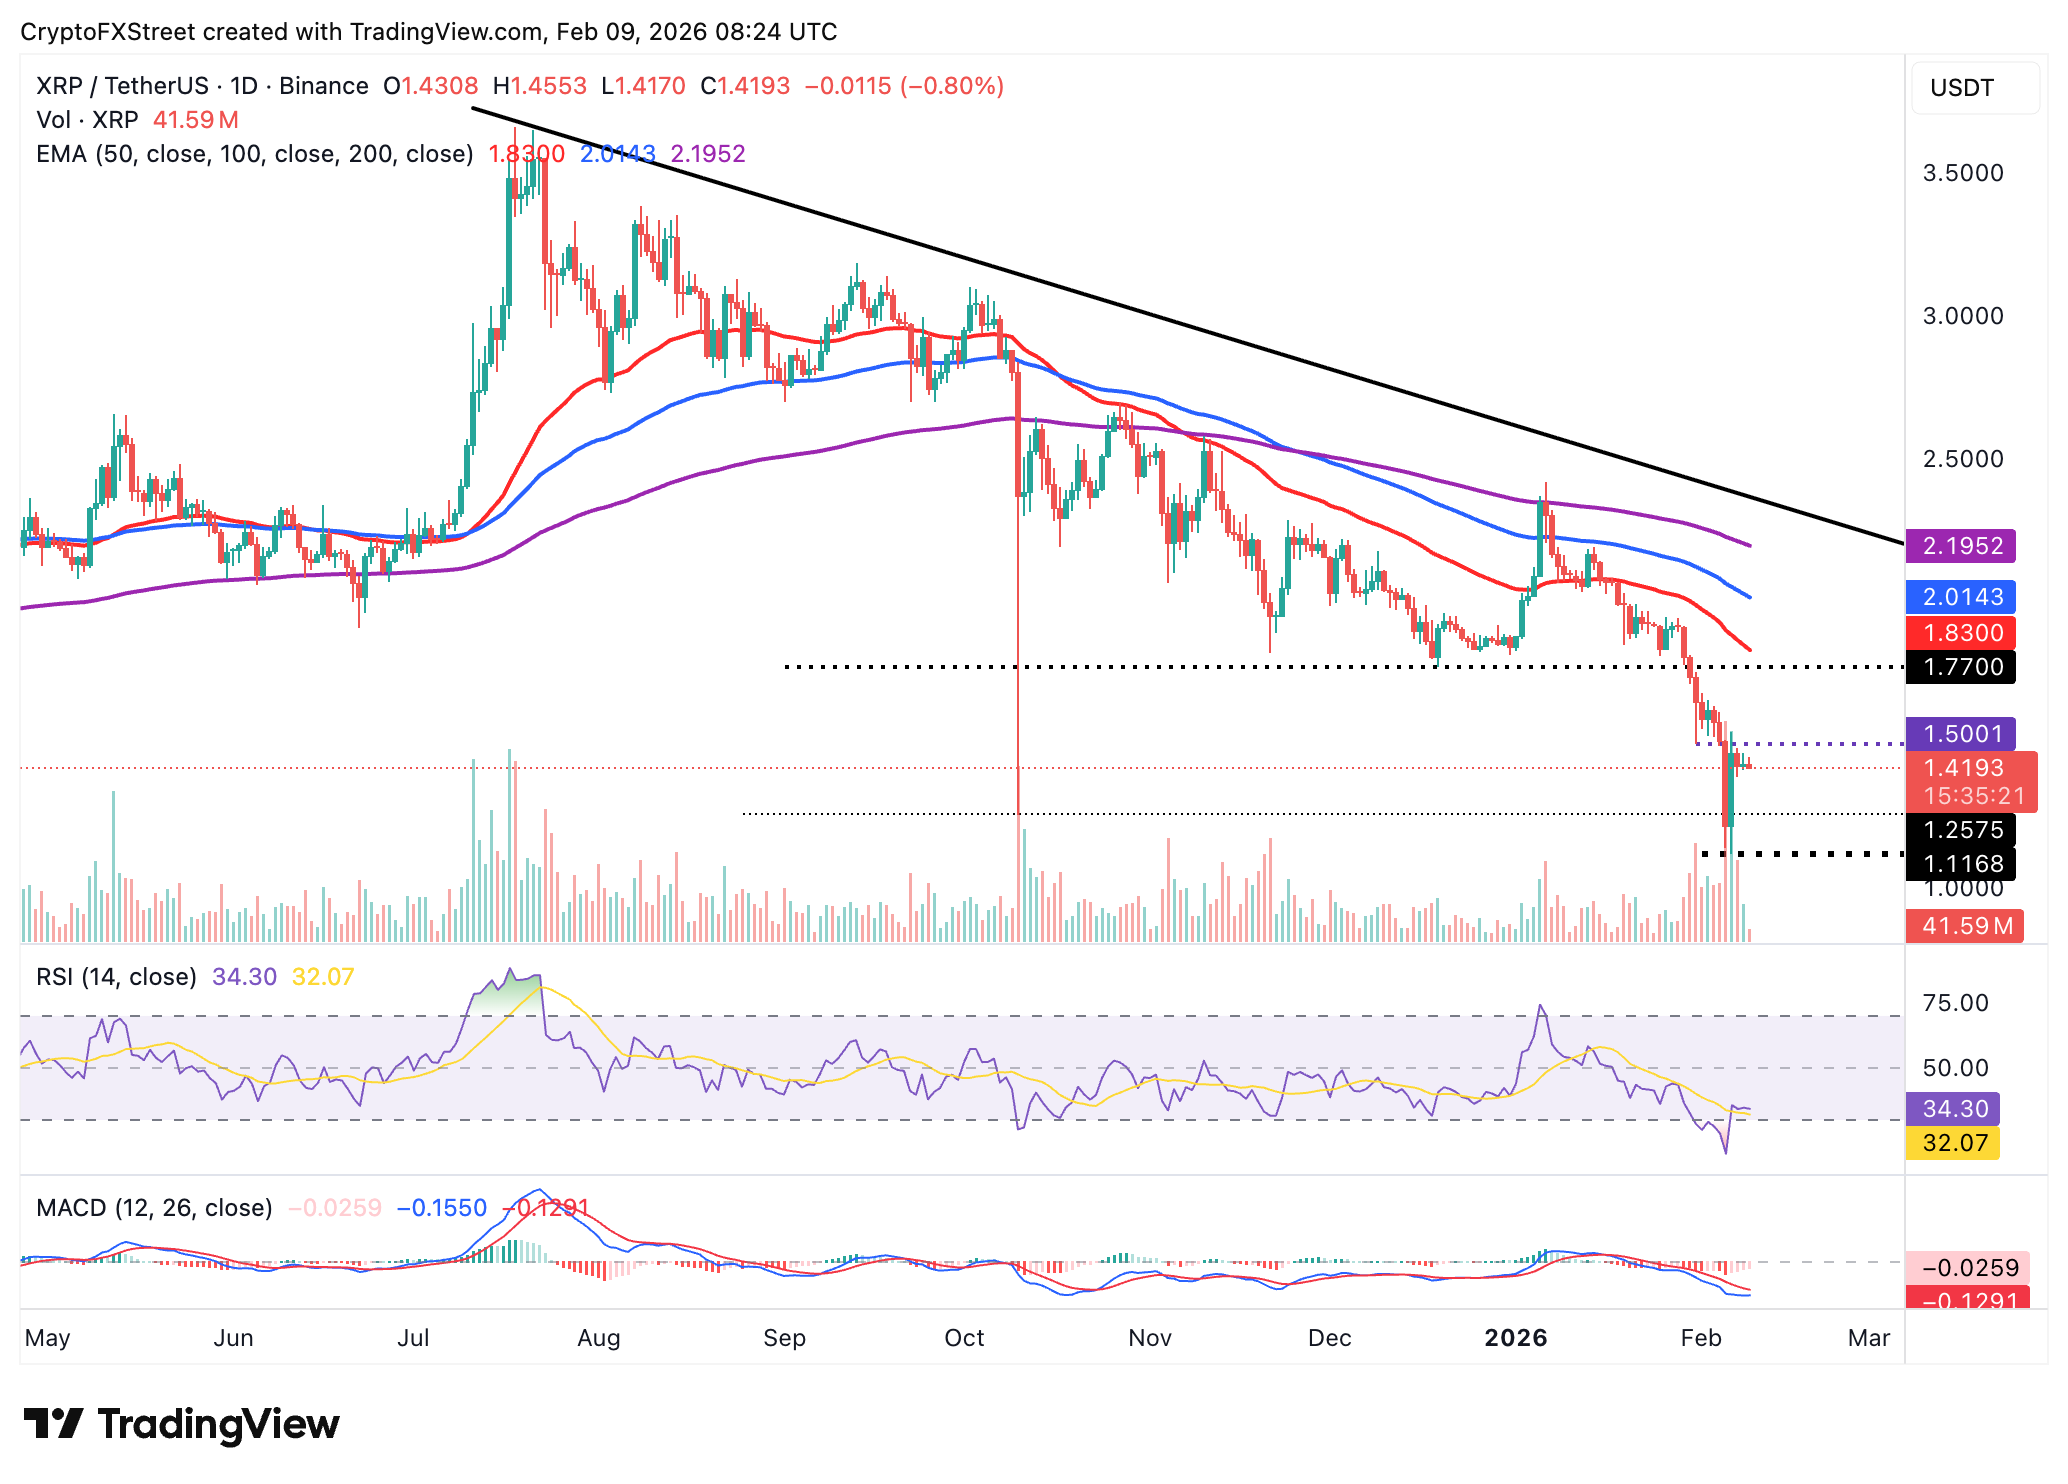
The MACD indicator sits below the signal line on the daily chart, making XRP shorts attractive while the RSI is at 34, pointing toward oversold territory, suggesting that the overall momentum is bearish. Key targets at $1.25, tested as support in October, and $1.12, tested on Friday, are poised to absorb the selling pressure.
Open Interest, funding rate FAQs
Higher Open Interest is associated with higher liquidity and new capital inflow to the market. This is considered the equivalent of increase in efficiency and the ongoing trend continues. When Open Interest decreases, it is considered a sign of liquidation in the market, investors are leaving and the overall demand for an asset is on a decline, fueling a bearish sentiment among investors.
Funding fees bridge the difference between spot prices and prices of futures contracts of an asset by increasing liquidation risks faced by traders. A consistently high and positive funding rate implies there is a bullish sentiment among market participants and there is an expectation of a price hike. A consistently negative funding rate for an asset implies a bearish sentiment, indicating that traders expect the cryptocurrency’s price to fall and a bearish trend reversal is likely to occur.