

Pepe Price Forecast: PEPE stalls as on-chain, derivatives data flash bullish signals

- Pepe is down 3% on Tuesday, following Monday's 7% rise, and is extending its consolidation below $0.00000500.
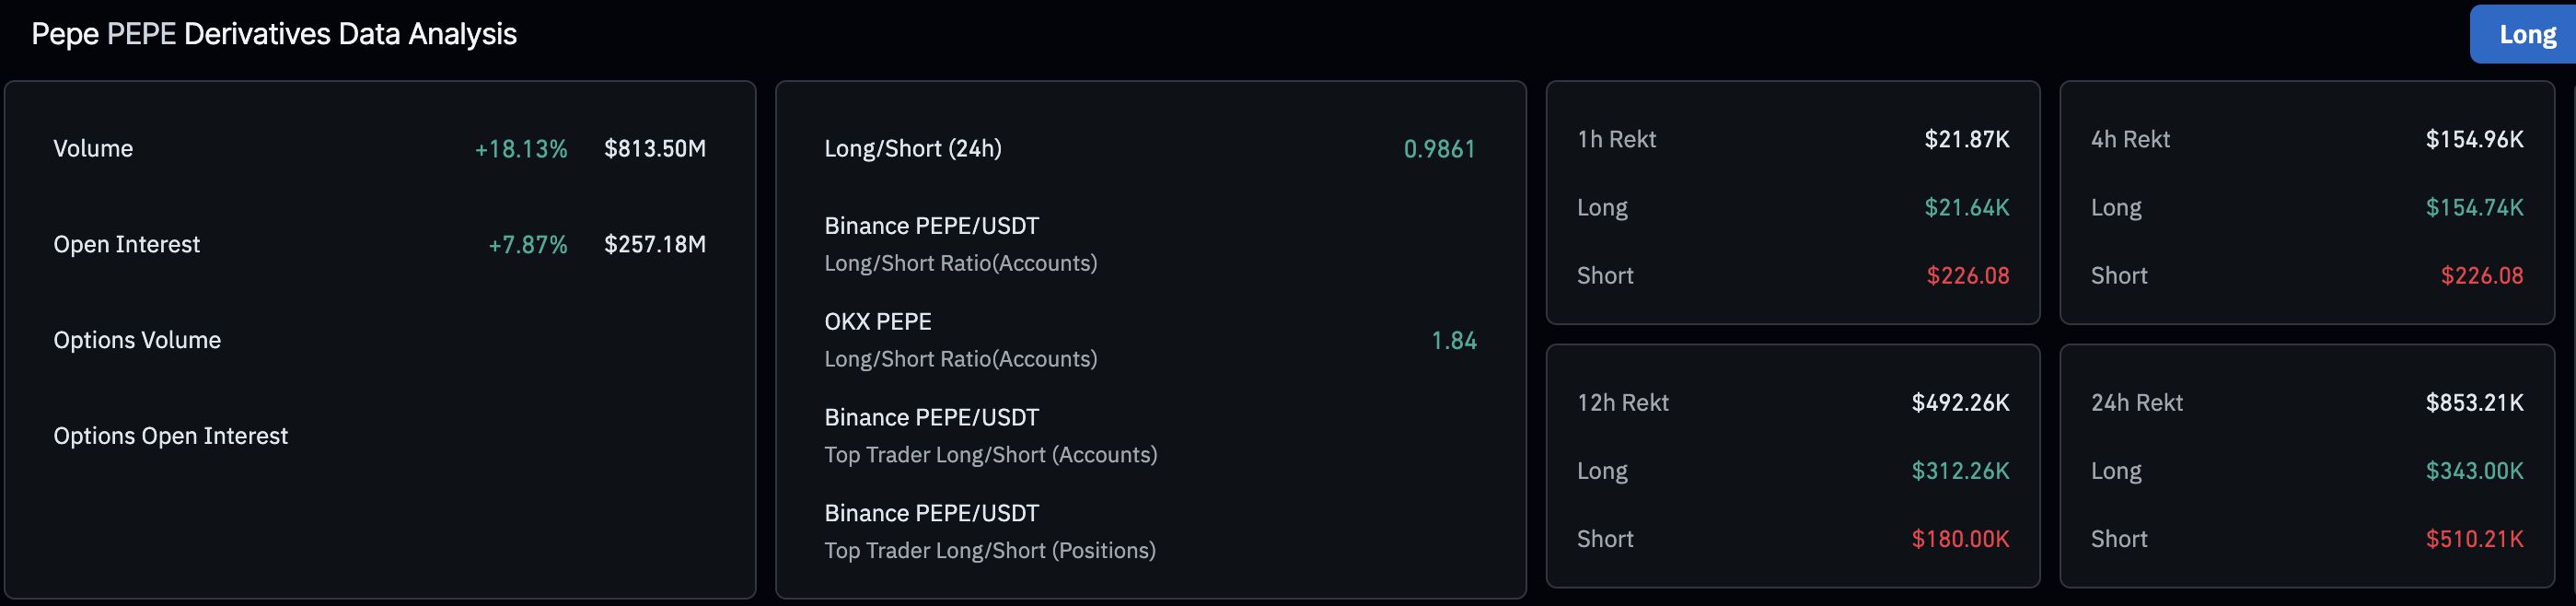
- A sudden surge in Pepe futures Open Interest points to increased investors’ confidence.
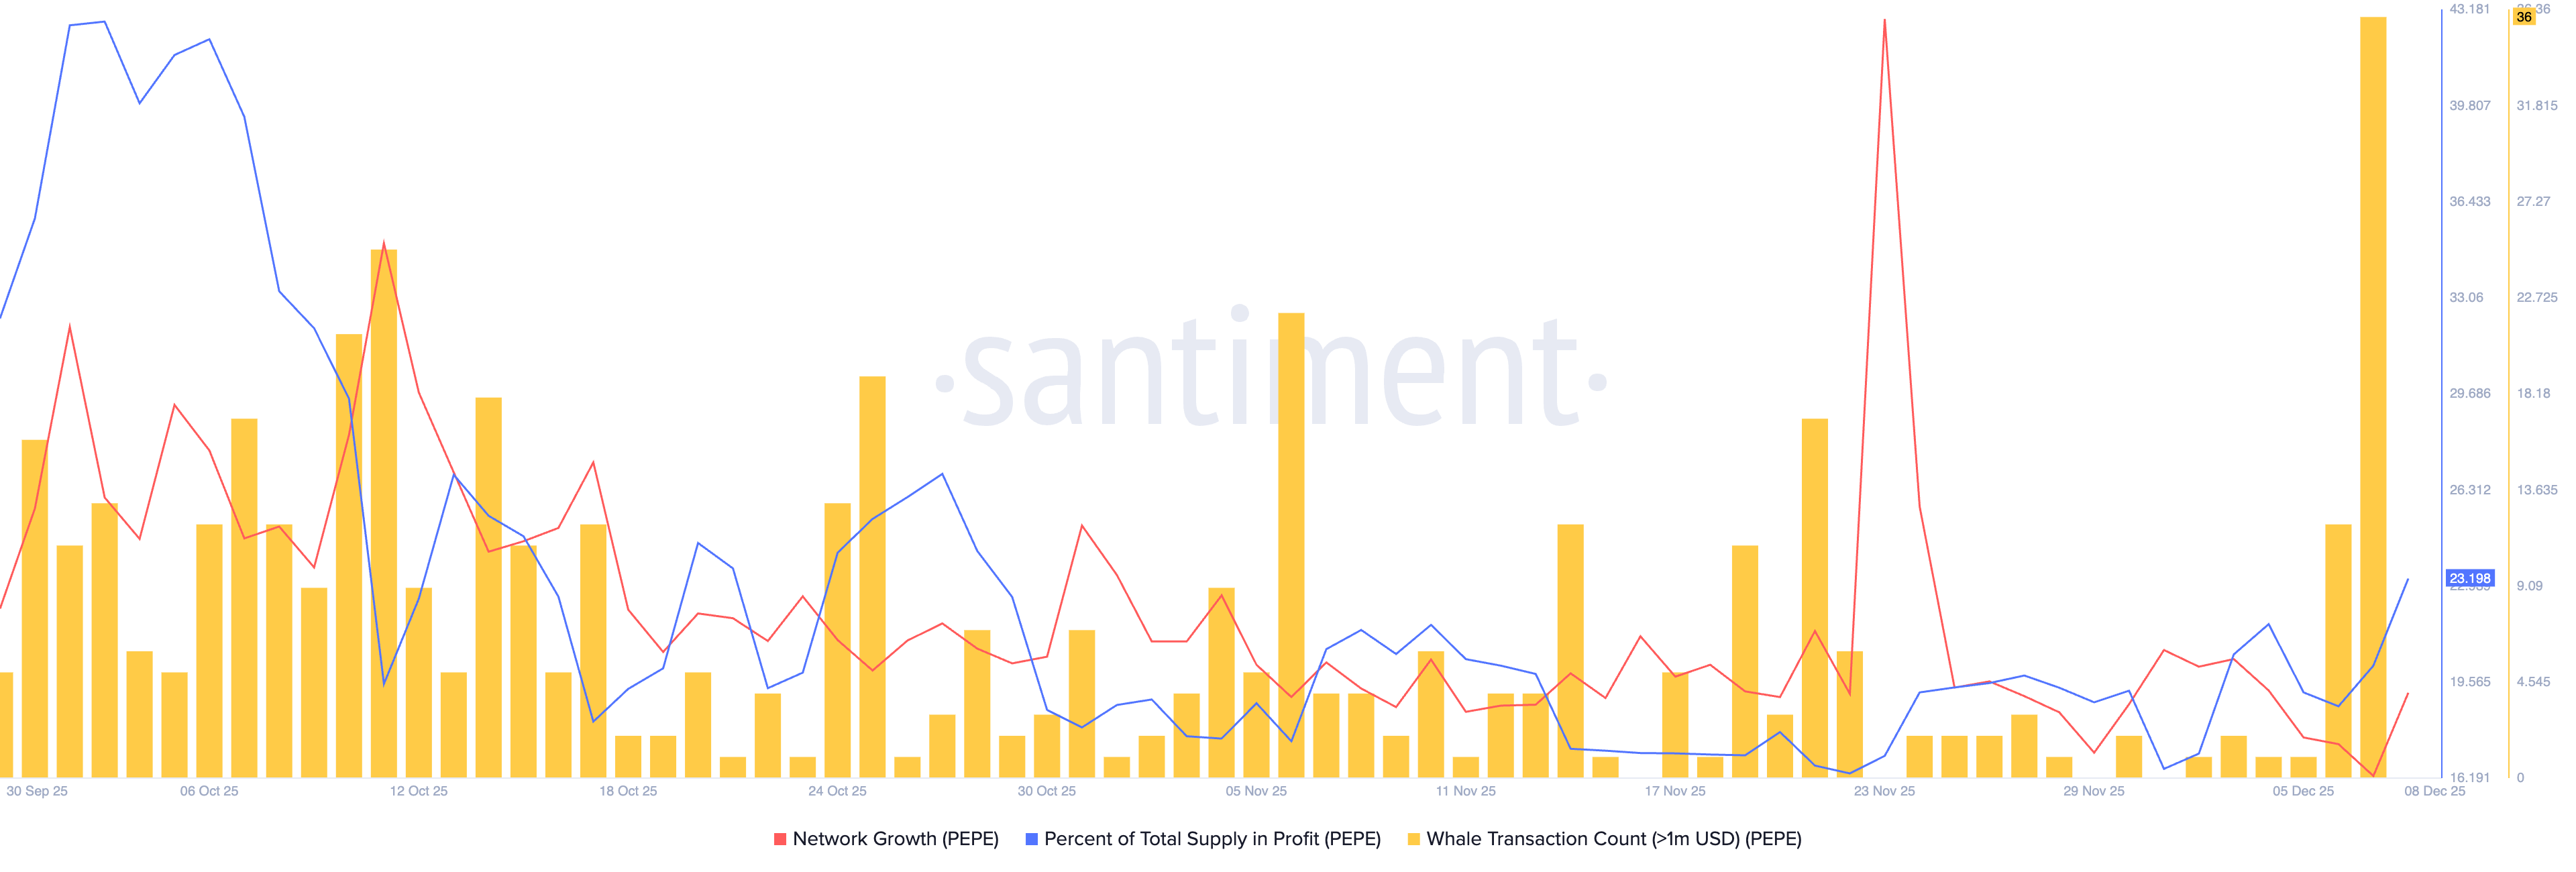
- On-chain data flashes bullish potential on rising network growth, supply in profit, and whale transactions.
Pepe (PEPE) trades in the red on Tuesday after failing to secure a daily close above the $0.00000500 psychological level on Monday. The technical outlook remains mixed as the meme coin consolidates. Still, the derivatives and on-chain data indicate a resurgence in retail interest that could boost the next rally in this frog-themed meme coin.
Derivatives and on-chain data flash bullish signals for PEPE
Pepe is regaining retail demand as derivatives traders are increasing risk exposure overnight. CoinGlass data shows a 7.87% surge in PEPE futures Open Interest (OI) in the last 24 hours, rising to $257.18 million. Generally, recovery runs in Pepe, and other meme coins are mainly driven by retail demand and speculation.
On the on-chain side, Santiment data shows a spike in network growth to 623 on Monday, up from 448 on Sunday, indicating a rise in the number of new addresses transferring PEPE for the first time. Meanwhile, the percentage of PEPE supply in profit stood at 23.20% on Monday, up from 20.14% on the previous day.
Large wallet investors, commonly referred to as whales, executed 36 transactions worth over $1 million on Sunday, signaling increased interest that fueled Monday’s 7% gains. As whales rekindle their interest in PEPE, the meme coin could regain lost levels.
Technical outlook: Could PEPE rally toward the 200-day EMA?
Pepe is trading below $0.000005000, down 3% by press time on Tuesday, potentially aiming for the $0.00000395 support level, which aligns with the November 21 low.
Still, the momentum indicators on the daily chart maintain a broadly neutral-to-bullish stance. The Relative Strength Index (RSI) at 45 is rising toward the midpoint from oversold territory, suggesting a decline in selling pressure.
Additionally, the Moving Average Convergence Divergence (MACD) remains steady near the zero line, with mainly green histogram bars, indicating bullish momentum.
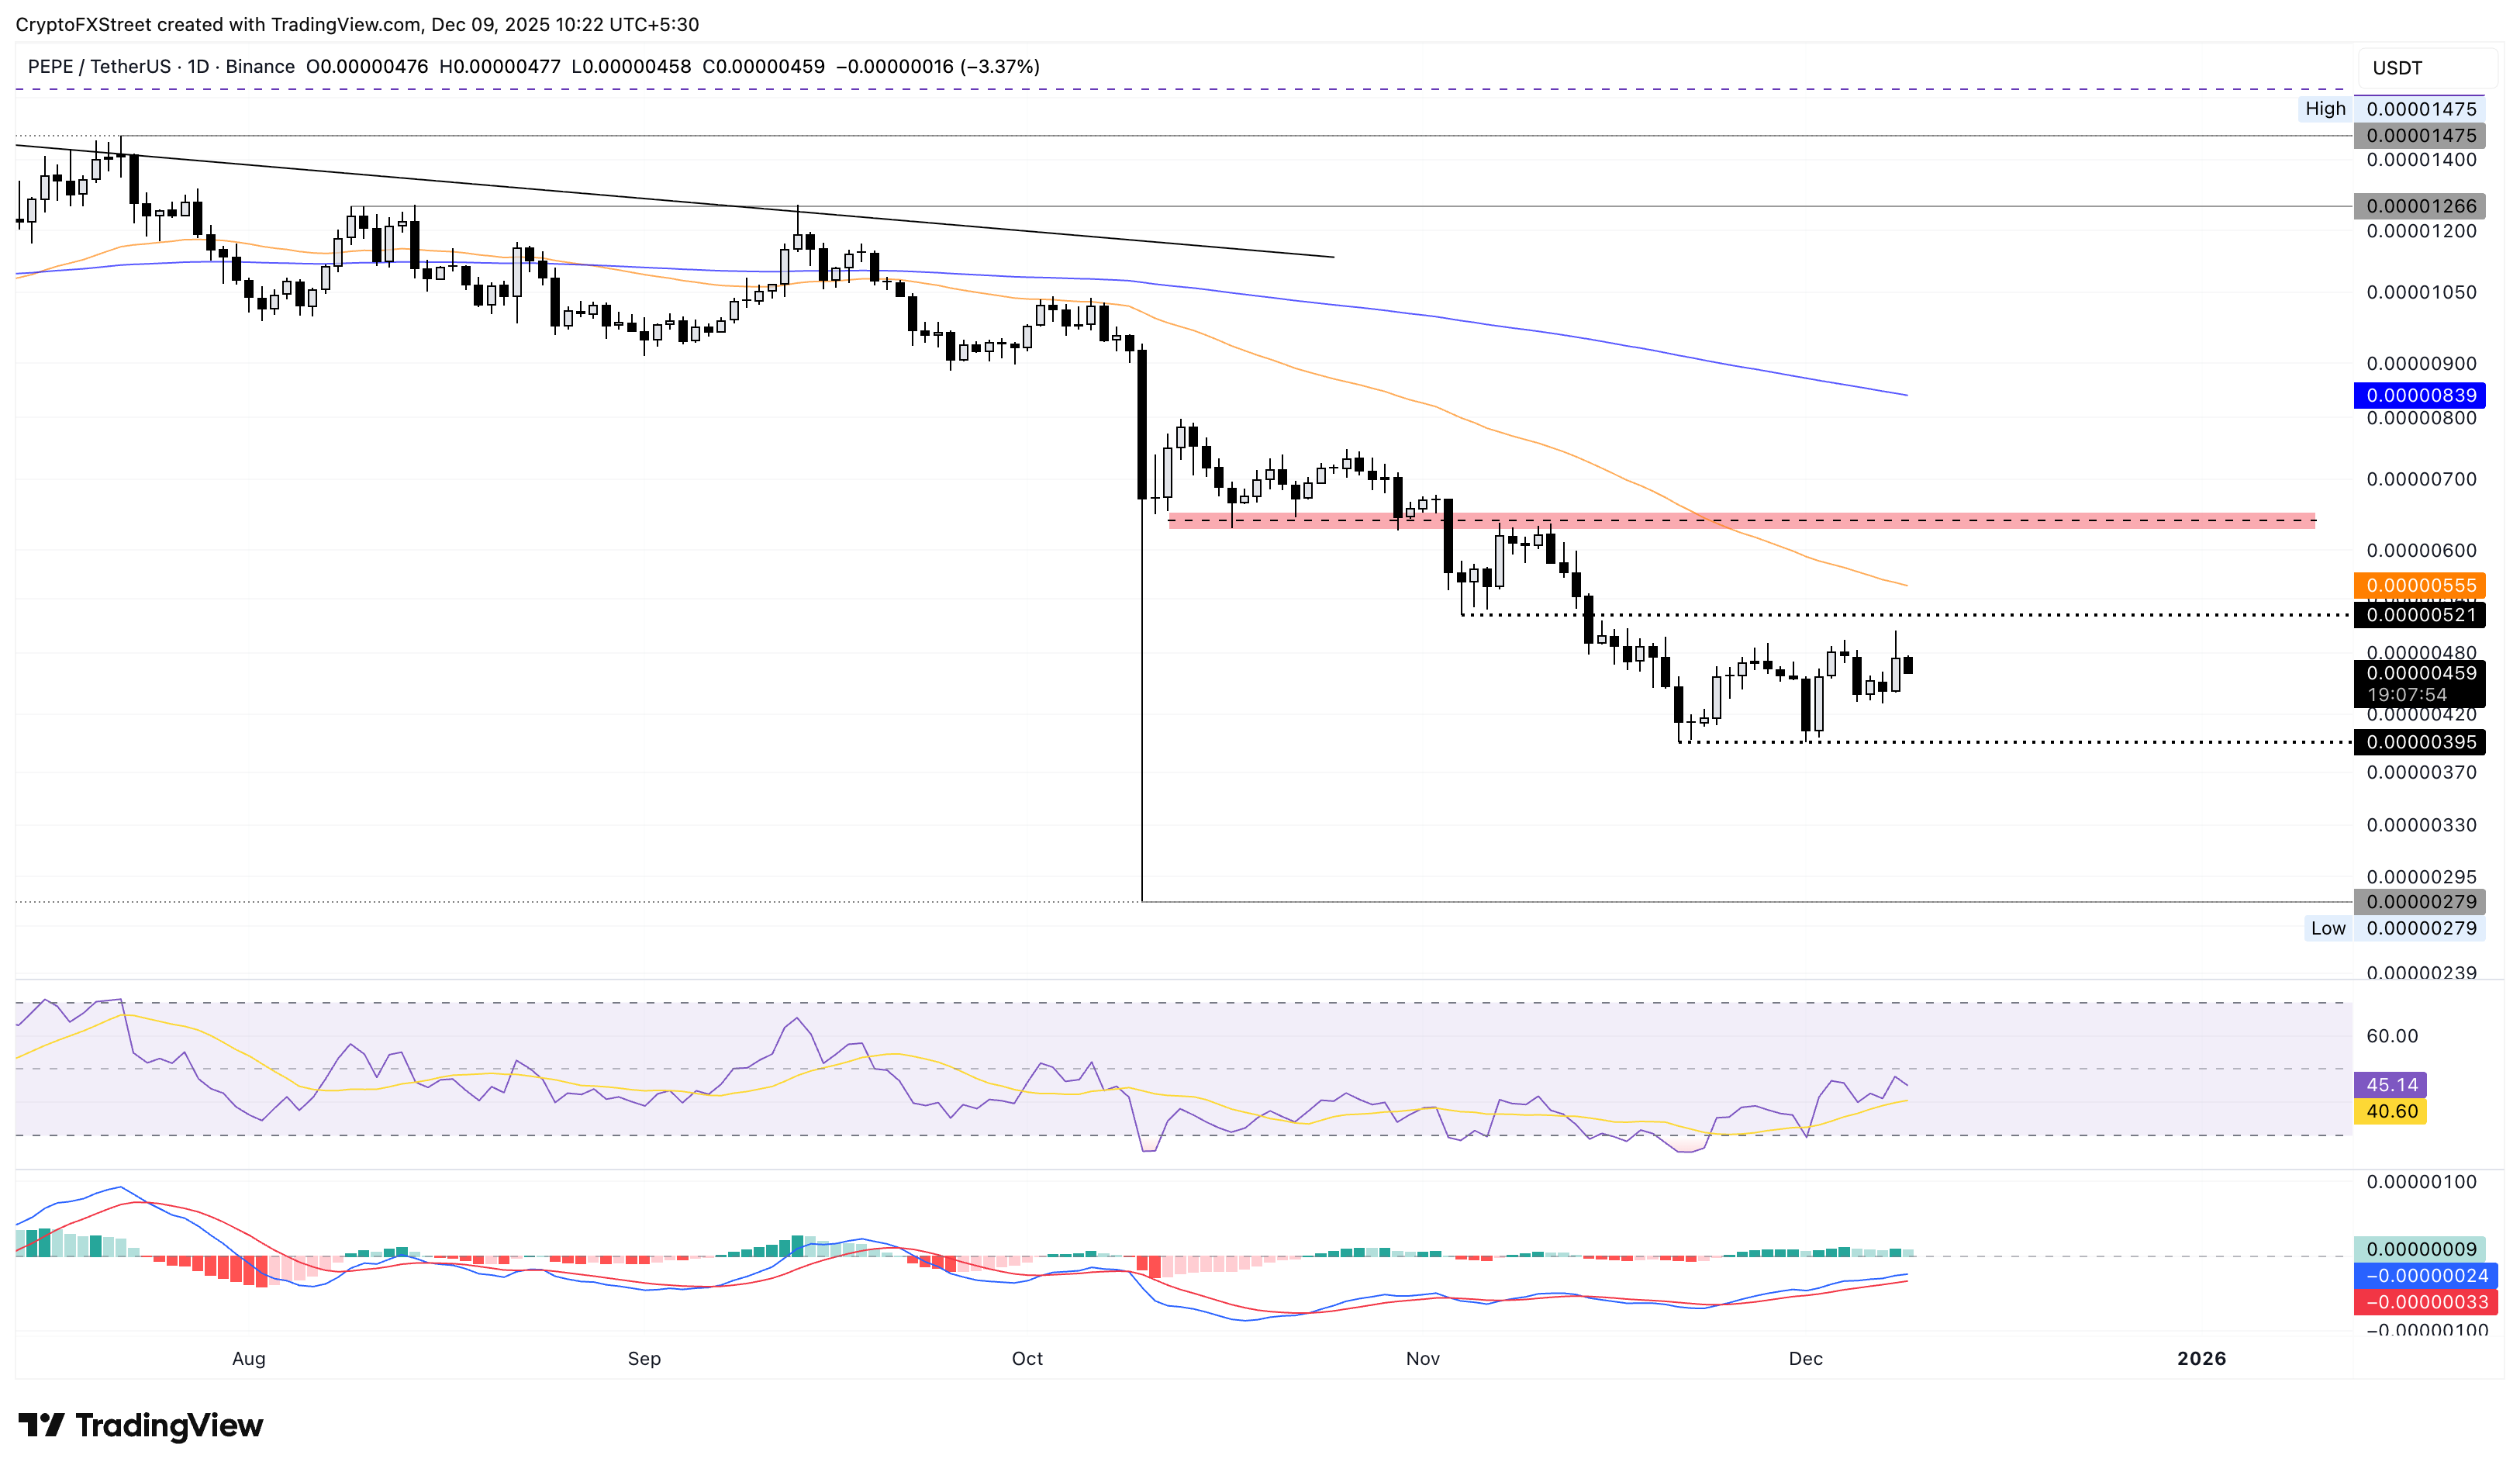
If PEPE secures a daily close above the $0.00000521 level marked by the November 4 low, it could aim for the supply present near $0.00000650, followed by the 200-day EMA at $0.00000839.
Related Articles
$660B Capex Bill Triggers $900B Wipeout: Why Apple Shares Outperform Amazon and Google Despite AI Lag
Based on financial disclosures, the combined 2026 capital expenditure forecasts for Meta, Amazon, Google, and Microsoft are projected to reach $660 billion. This figure is not only significantly higher than the $410 billion forecast for 2025 and $245 billion for 2024, but even surpasses the GDP of I
Amazon Stock Predictions for 2026 to 2030: Will They Exceed Expectations and Achieve Major Long-Term Goals?
TradingKey - As we head into 2026, many investors are questioning where Amazon (AMZN) fits into the technology world.
A Crash After a Surge: Why Silver Lost 40% in a Week?
TradingKey - Spot silver (XAGUSD) prices continue to decline. Silver plunged 20% on Thursday, breaking below $71 per ounce, with the sell-off intensifying on Friday as prices fell further below $64. Compared to the all-time high set on January 29, silver prices have retraced more than 40%, wiping out nearly all gains accumulated over the previous month.
Is Bitcoin’s Four-Year Cycle Dead in 2026?
Is the Bitcoin 4-year cycle dead? After 2025 broke historical records with a red post-halving year, institutional analysts explore if the Bitcoin price has decoupled from the halving countdown. Analyze the impact of spot ETFs, global liquidity, and the roadmap to the 2028 halving in this 2026 market

