

Solana Price Forecast: Rising demand in SOL ETFs and derivatives boosts bullish rebound

- Solana extends the 9% recovery from Tuesday, aiming for the 50-day EMA at $157.
- Derivatives data suggest a positive shift in investors' risk appetite as Open Interest increases.
- Solana ETFs record a surge in inflows amid Vanguard’s approval of crypto ETFs.
Solana (SOL) trades above $140 by press time on Wednesday, up over 10% in the last 24 hours as Vanguard offers crypto Exchange Traded Funds (ETFs), including Solana ETFs. The sudden recovery boosts risk-on sentiment in Solana derivatives as investors anticipate further gains. Technically, the outlook for Solana centers on a potential double-bottom breakout targeting the 50-day Exponential Moving Average (EMA).
Demand is back for Solana on all levels
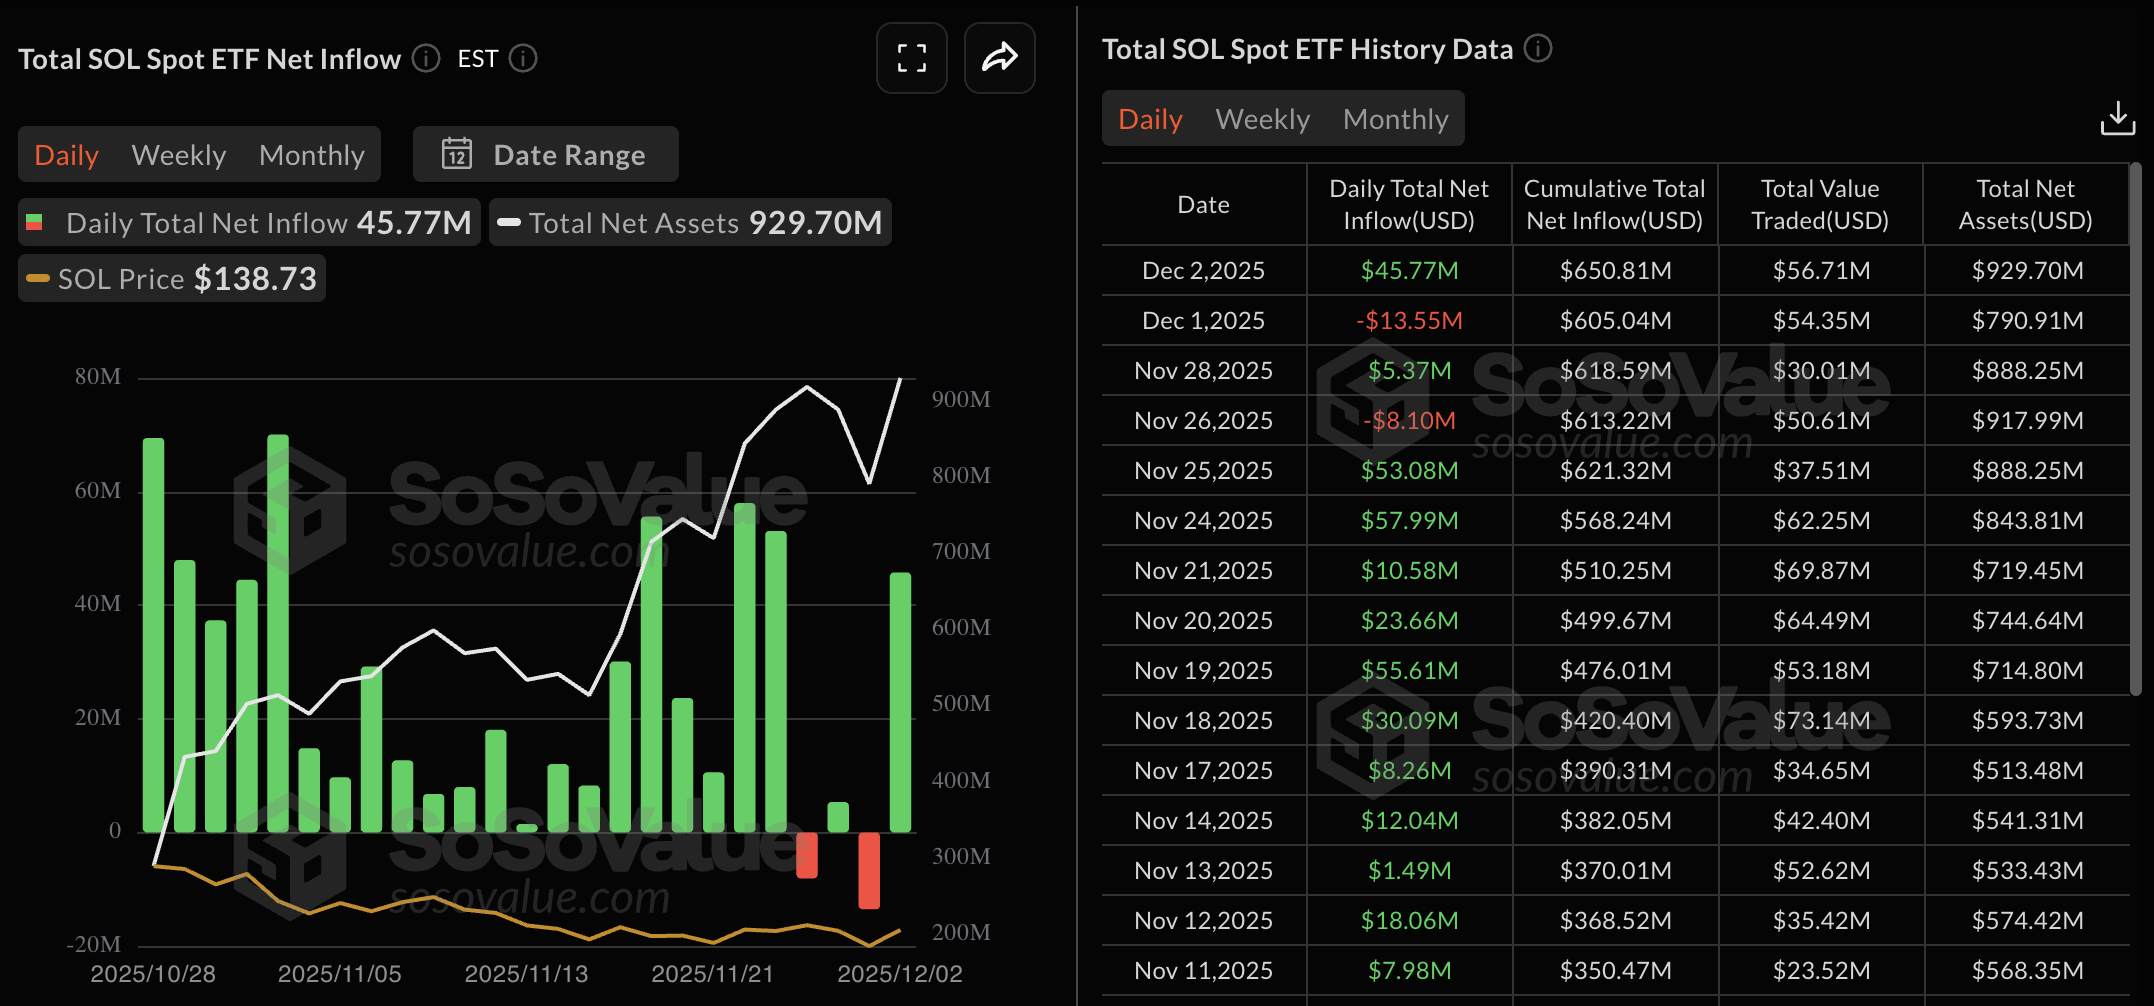
Vanguard's crypto-focused ETFs, including Bitcoin (BTC), Ethereum (ETH), Solana (SOL), and Ripple (XRP), are heating up the cryptocurrency market. Solana is experiencing a renewal in institutional demand with a net inflow of $45.77 million on Tuesday, flipping up from a net outflow of $13.55 million on Monday. Typically, an increase in ETF inflows signals better odds of further recovery and boosts investor confidence.
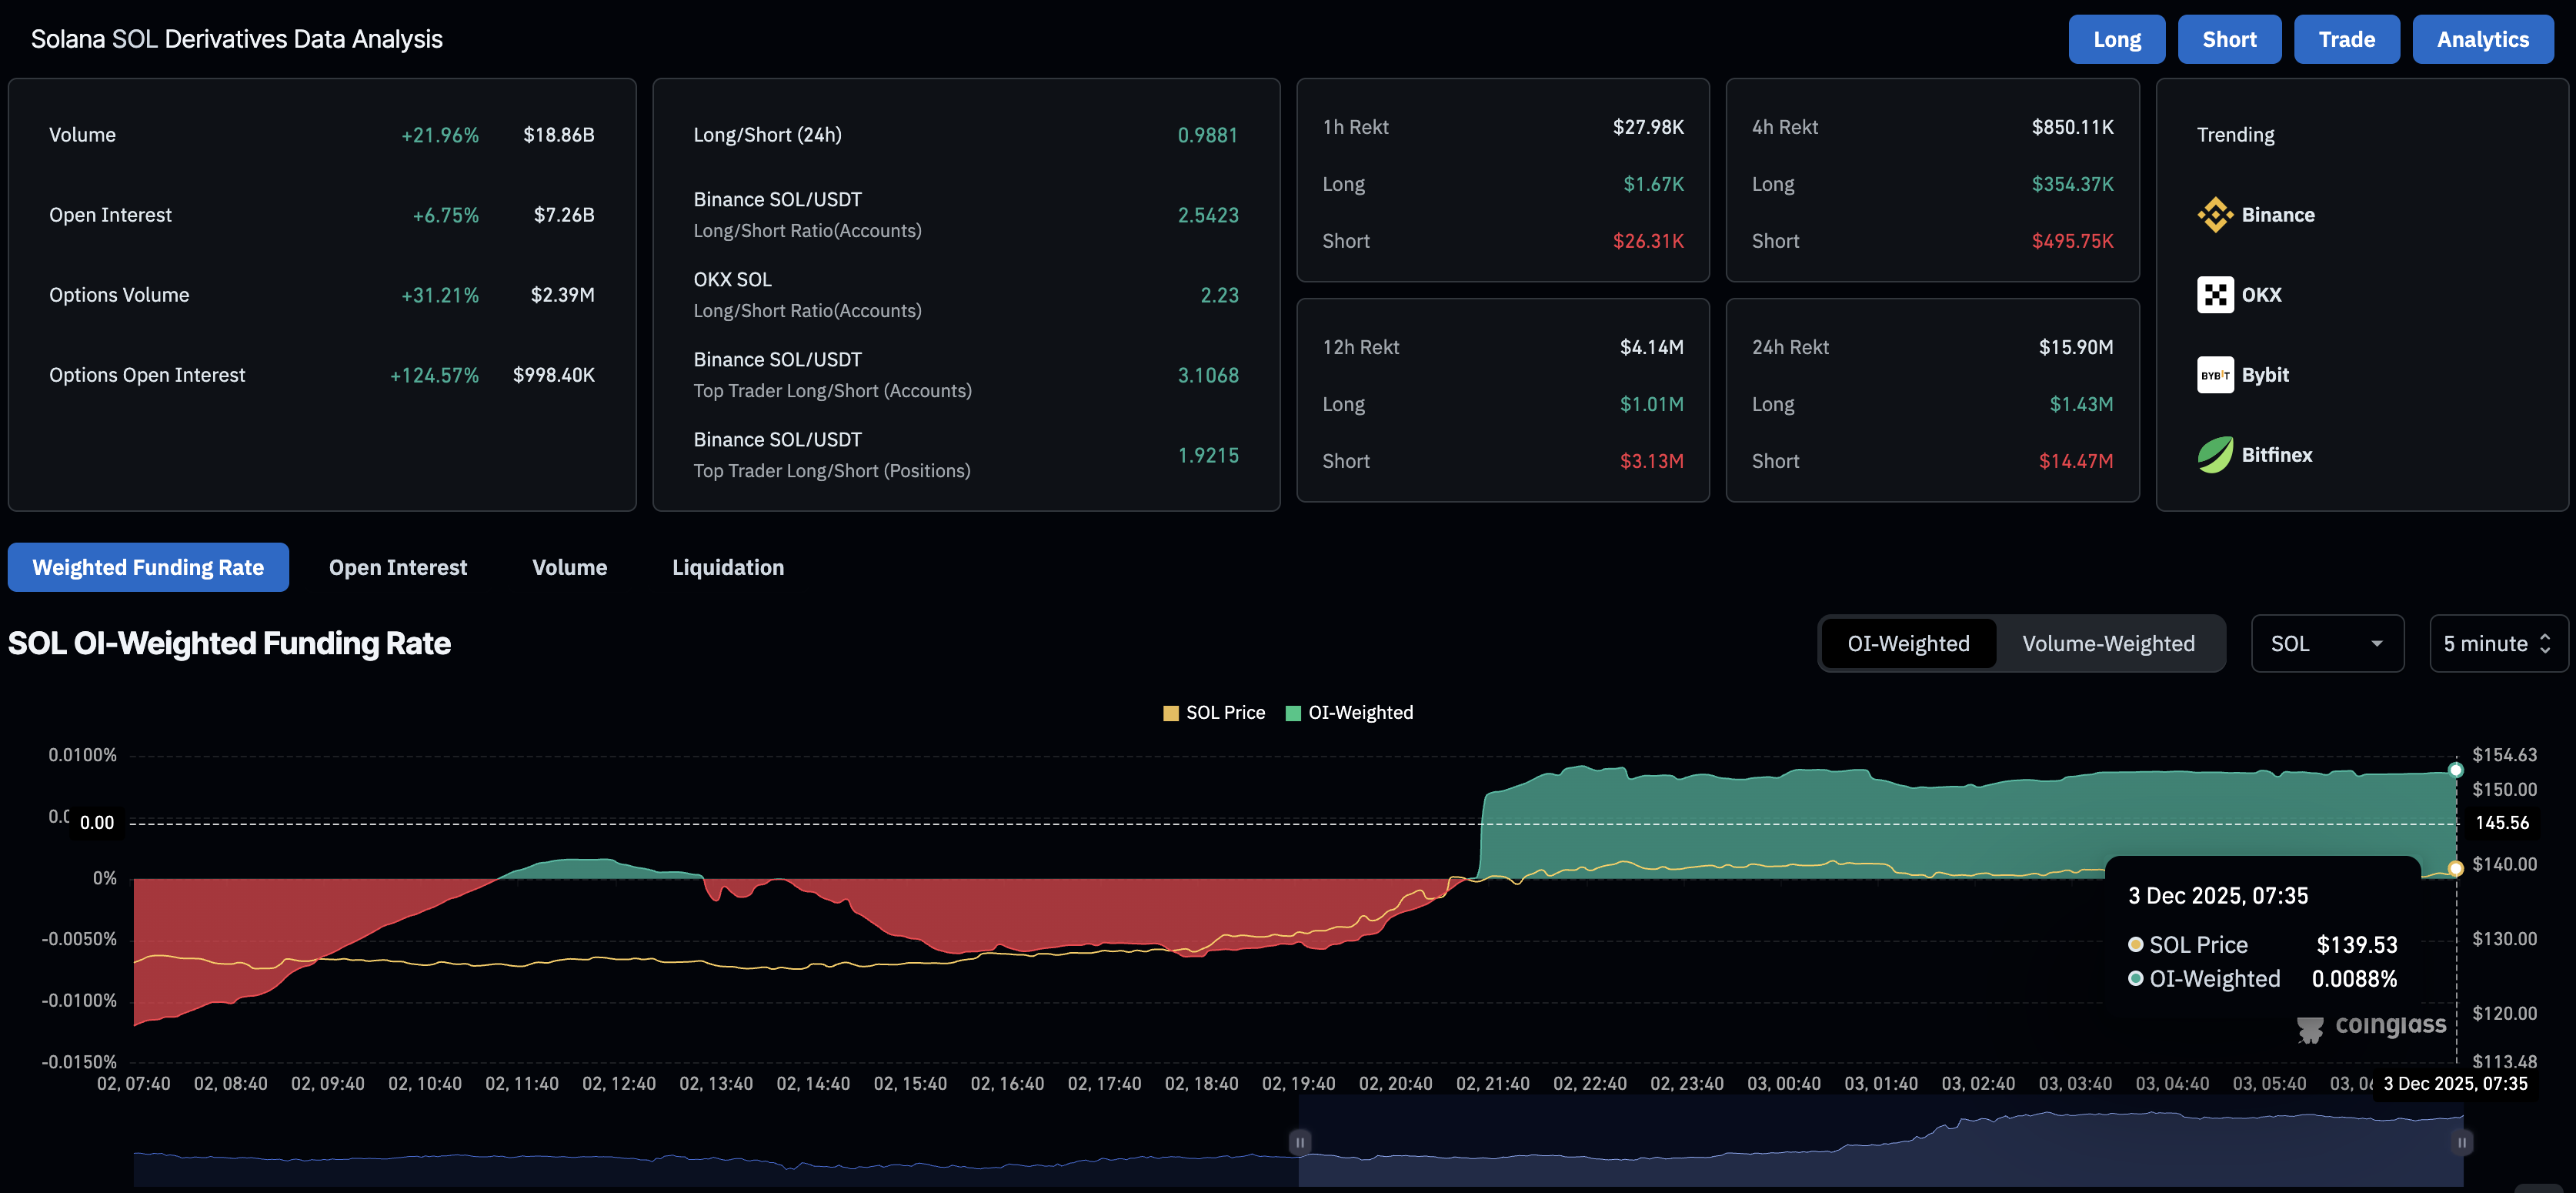
In line with institutional demand, Solana derivatives experience a rise in risk exposure as investors bet on further recovery. CoinGlass data shows that Solana futures Open Interest (OI) stands at $7.26 billion, up 6.75% over the last 24 hours, reflecting an increase in capital at risk.
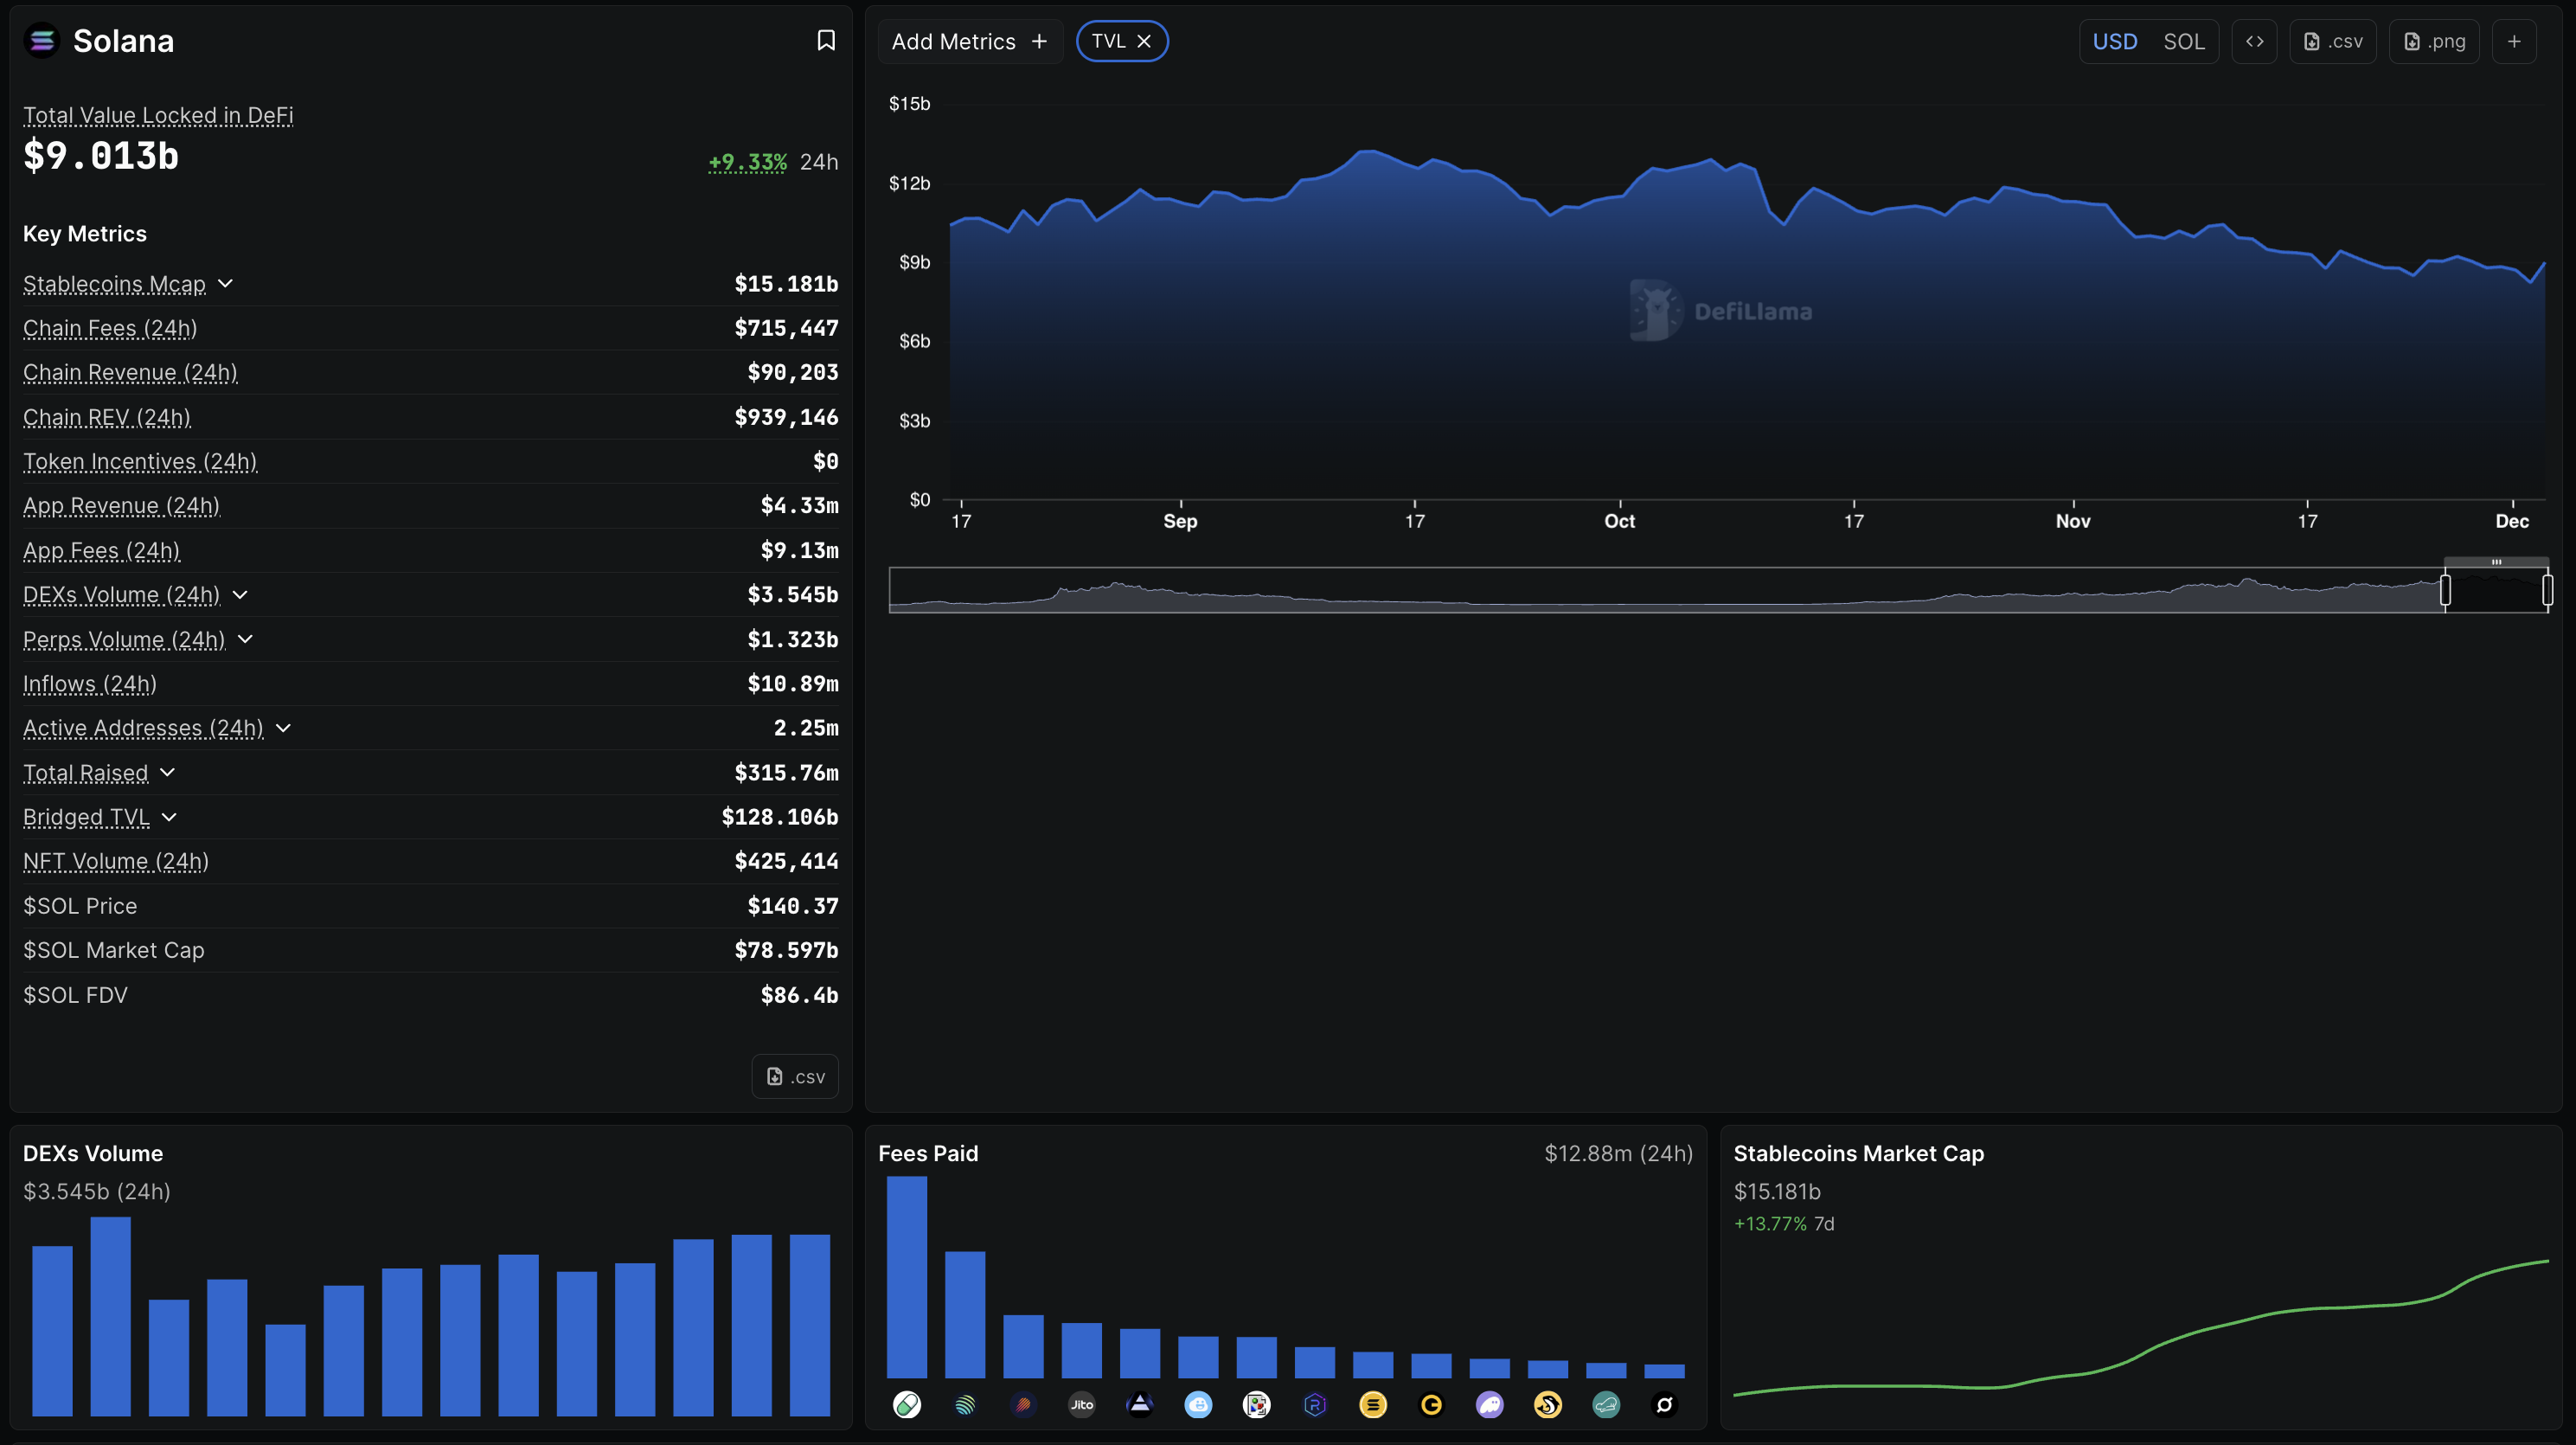
On a more positive note, on-chain data shows an increase in Solana adoption, with its Total Value Locked (TVL) rising 9.33% in the last 24 hours to $9.013 billion. A surge in TVL reflects increased user deposits on the blockchain, signaling greater activity and adoption.
Additionally, the stablecoin liquidity on Solana has increased by over 13% in the last week to $15.181 billion.
Technical outlook: Is Solana ready for a breakthrough?
Solana bounced off the $126 support, which has remained intact since the June 22 low and avoided a daily close beneath it. The rebound also forms a double-bottom pattern with a neckline near $145, close to the November 20 high.
If SOL confirms a daily close above $145, it could extend the rally to the 50-day EMA at $158, followed by the 200-day EMA at $175.
The Relative Strength Index (RSI) at 48 on the daily chart shows a steady rise from oversold levels, indicating a sharp decline in bearish pressure. At the same time, the Moving Average Convergence Divergence (MACD) shows steady recovery within the negative territory.
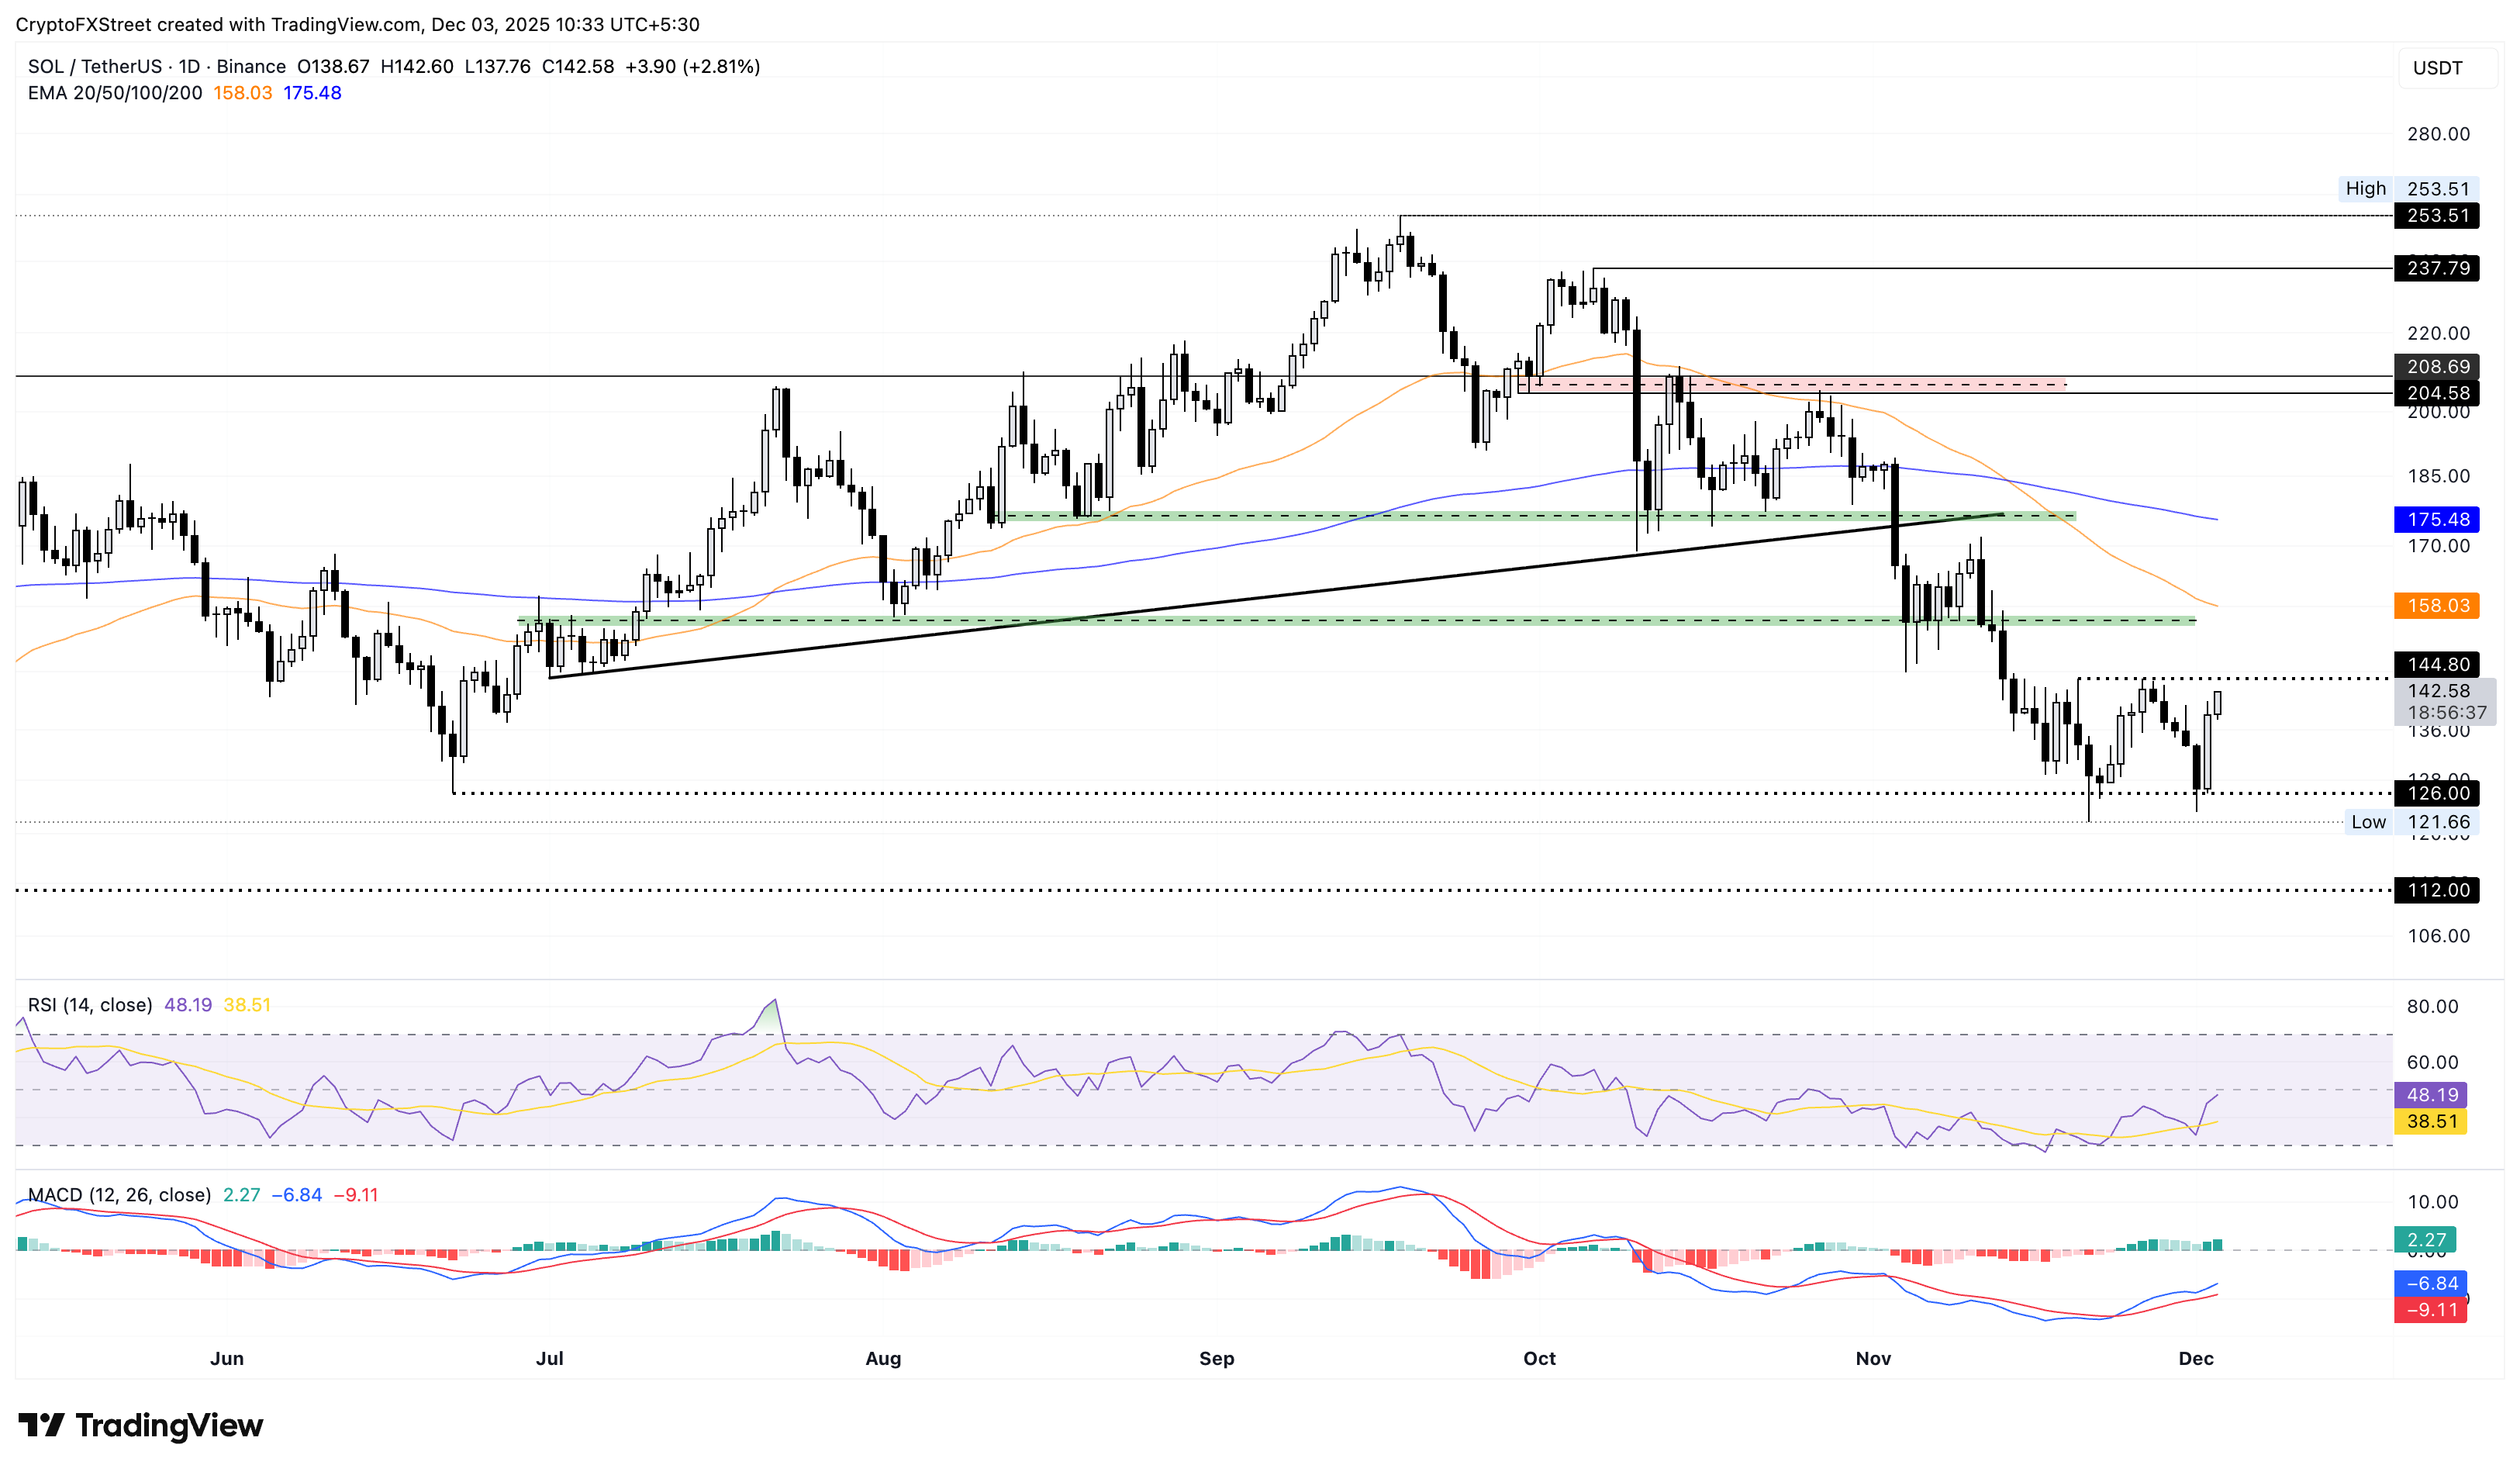
On the flip side, a reversal from $145 could shift Solana into a consolidation phase with the lower band at $126.
Related Articles
$660B Capex Bill Triggers $900B Wipeout: Why Apple Shares Outperform Amazon and Google Despite AI Lag
Based on financial disclosures, the combined 2026 capital expenditure forecasts for Meta, Amazon, Google, and Microsoft are projected to reach $660 billion. This figure is not only significantly higher than the $410 billion forecast for 2025 and $245 billion for 2024, but even surpasses the GDP of I
Amazon Stock Predictions for 2026 to 2030: Will They Exceed Expectations and Achieve Major Long-Term Goals?
TradingKey - As we head into 2026, many investors are questioning where Amazon (AMZN) fits into the technology world.
A Crash After a Surge: Why Silver Lost 40% in a Week?
TradingKey - Spot silver (XAGUSD) prices continue to decline. Silver plunged 20% on Thursday, breaking below $71 per ounce, with the sell-off intensifying on Friday as prices fell further below $64. Compared to the all-time high set on January 29, silver prices have retraced more than 40%, wiping out nearly all gains accumulated over the previous month.
Is Bitcoin’s Four-Year Cycle Dead in 2026?
Is the Bitcoin 4-year cycle dead? After 2025 broke historical records with a red post-halving year, institutional analysts explore if the Bitcoin price has decoupled from the halving countdown. Analyze the impact of spot ETFs, global liquidity, and the roadmap to the 2028 halving in this 2026 market

