

Solana Price Forecast: SOL hits key support as sell-off wave cools down

- Solana holds above $130, aiming for a rebound as RSI flashes oversold conditions.
- Selling pressure declines in the cash and futures markets, as large wallet investors return to the spot market.
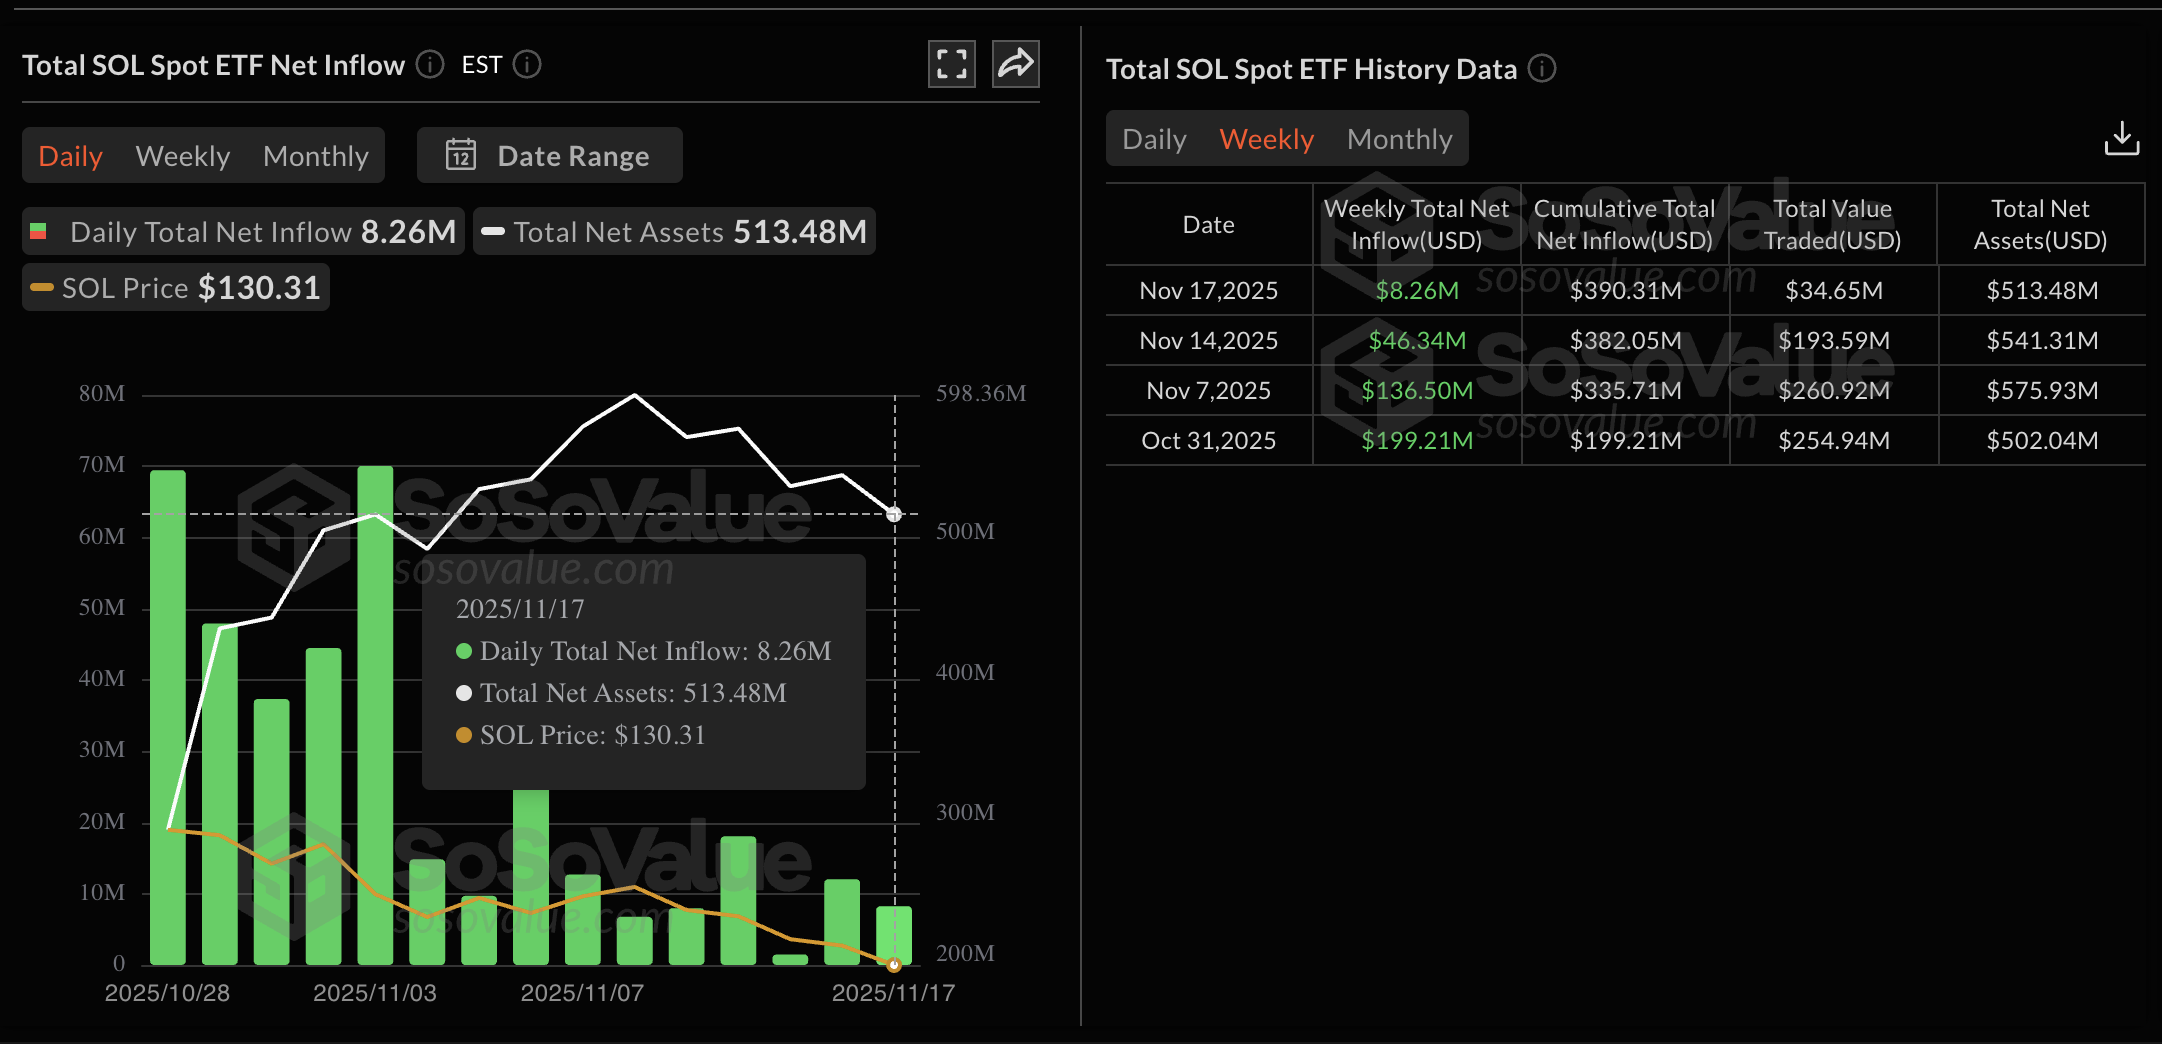
- Institutional demand remains unfazed for Solana as ETF inflows record $8.26 million on Monday.
Solana (SOL) edges higher by 2% at press time on Tuesday, holding above the $130 mark. The technical outlook for Solana focuses on key support at $126 amid heightened selling pressure. However, steady inflows from Solana Exchange Traded Funds (ETFs) and an underlying shift in the spot and futures markets could help SOL rebound.
Dip in Solana shifts investors' sentiment
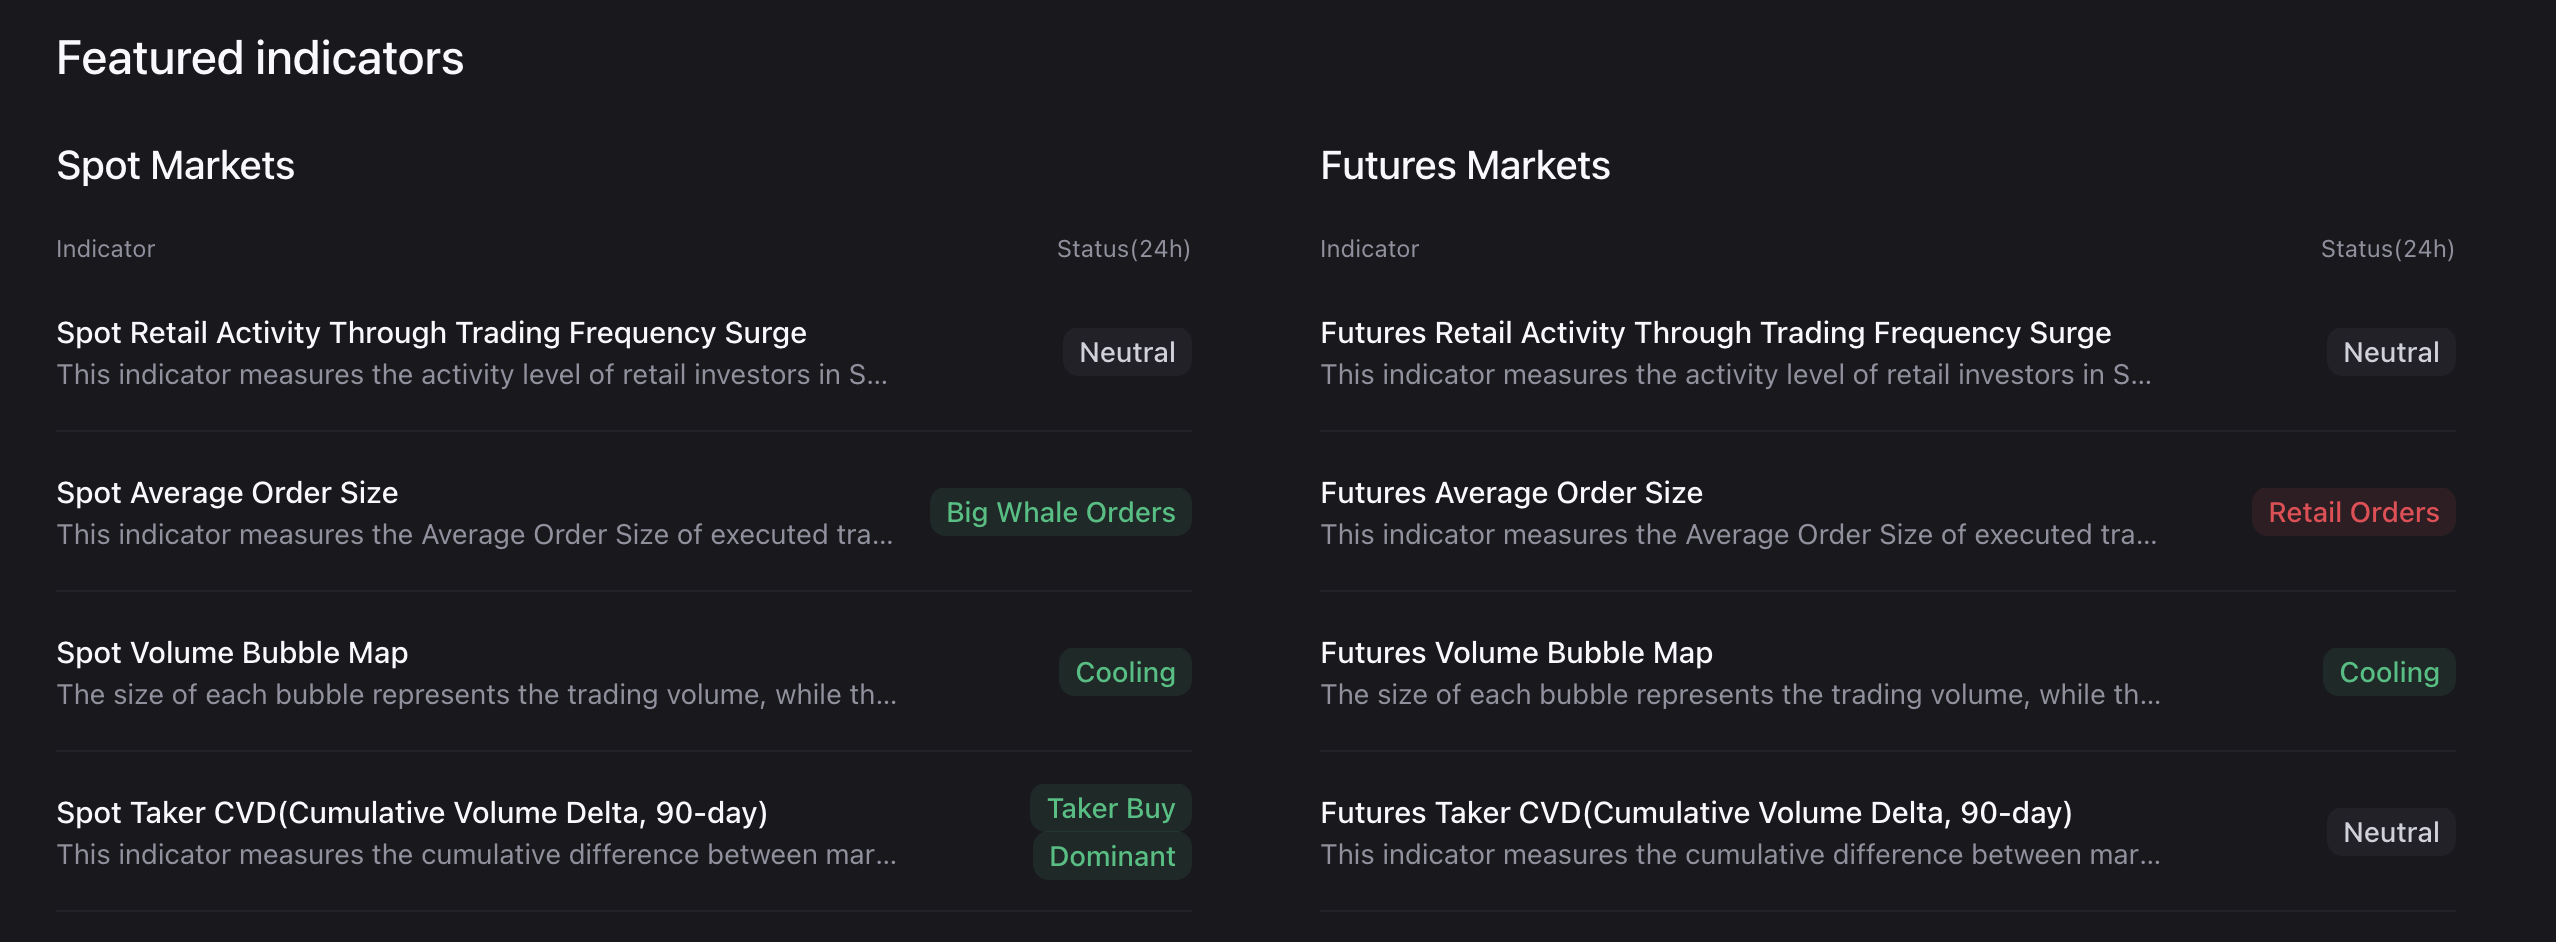
Solana is experiencing a surge in demand from large wallet investors, commonly referred to as whales, who are keen to buy the dip. According to CryptoQuant, the average order size of the executed trades in the SOL spot market indicates large whale orders. Furthermore, the Cumulative Volume Delta (CVD) indicates a positive difference in the market's buy and sell order volume, suggesting buy-side dominance.
At the same time, the volume bubble map, which tracks the difference in trading volume, indicates a decline in both spot and futures markets. This decrease in trading volume, amid a prevailing declining trend, signals reduced selling pressure that could act as dry powder for the subsequent Solana rebound.
Meanwhile, despite Solana being down over 30% from October 28, the institutional demand remains steady. The SOL ETFs recorded a net inflow of $8.25 million on Monday, marking 15 consecutive days of positive flows.
Solana hits a crucial crossroads, preparing for a rebound
Solana holds above the S2 Pivot Point at $128, slightly above the bearish target of $126, marked by the June 22 low, as previously reported by FXStreet. However, the close alignment of these strong supports could absorb the incoming supply, potentially leading to a bounce back.
This potential rebound in SOL could test the $150 psychological level near the $155 supply zone.
Still, the technical indicators on the daily chart tilt bearish, as the Moving Average Convergence Divergence (MACD) continues to extend the declining trend with the signal line.
Even the Relative Strength Index (RSI) at 30 hovers near the oversold boundary, signaling heightened selling pressure. However, extreme oversold conditions, indicated by RSI values below 30, signal a potential reversal as investors shift to buy the dip at undervalued prices.
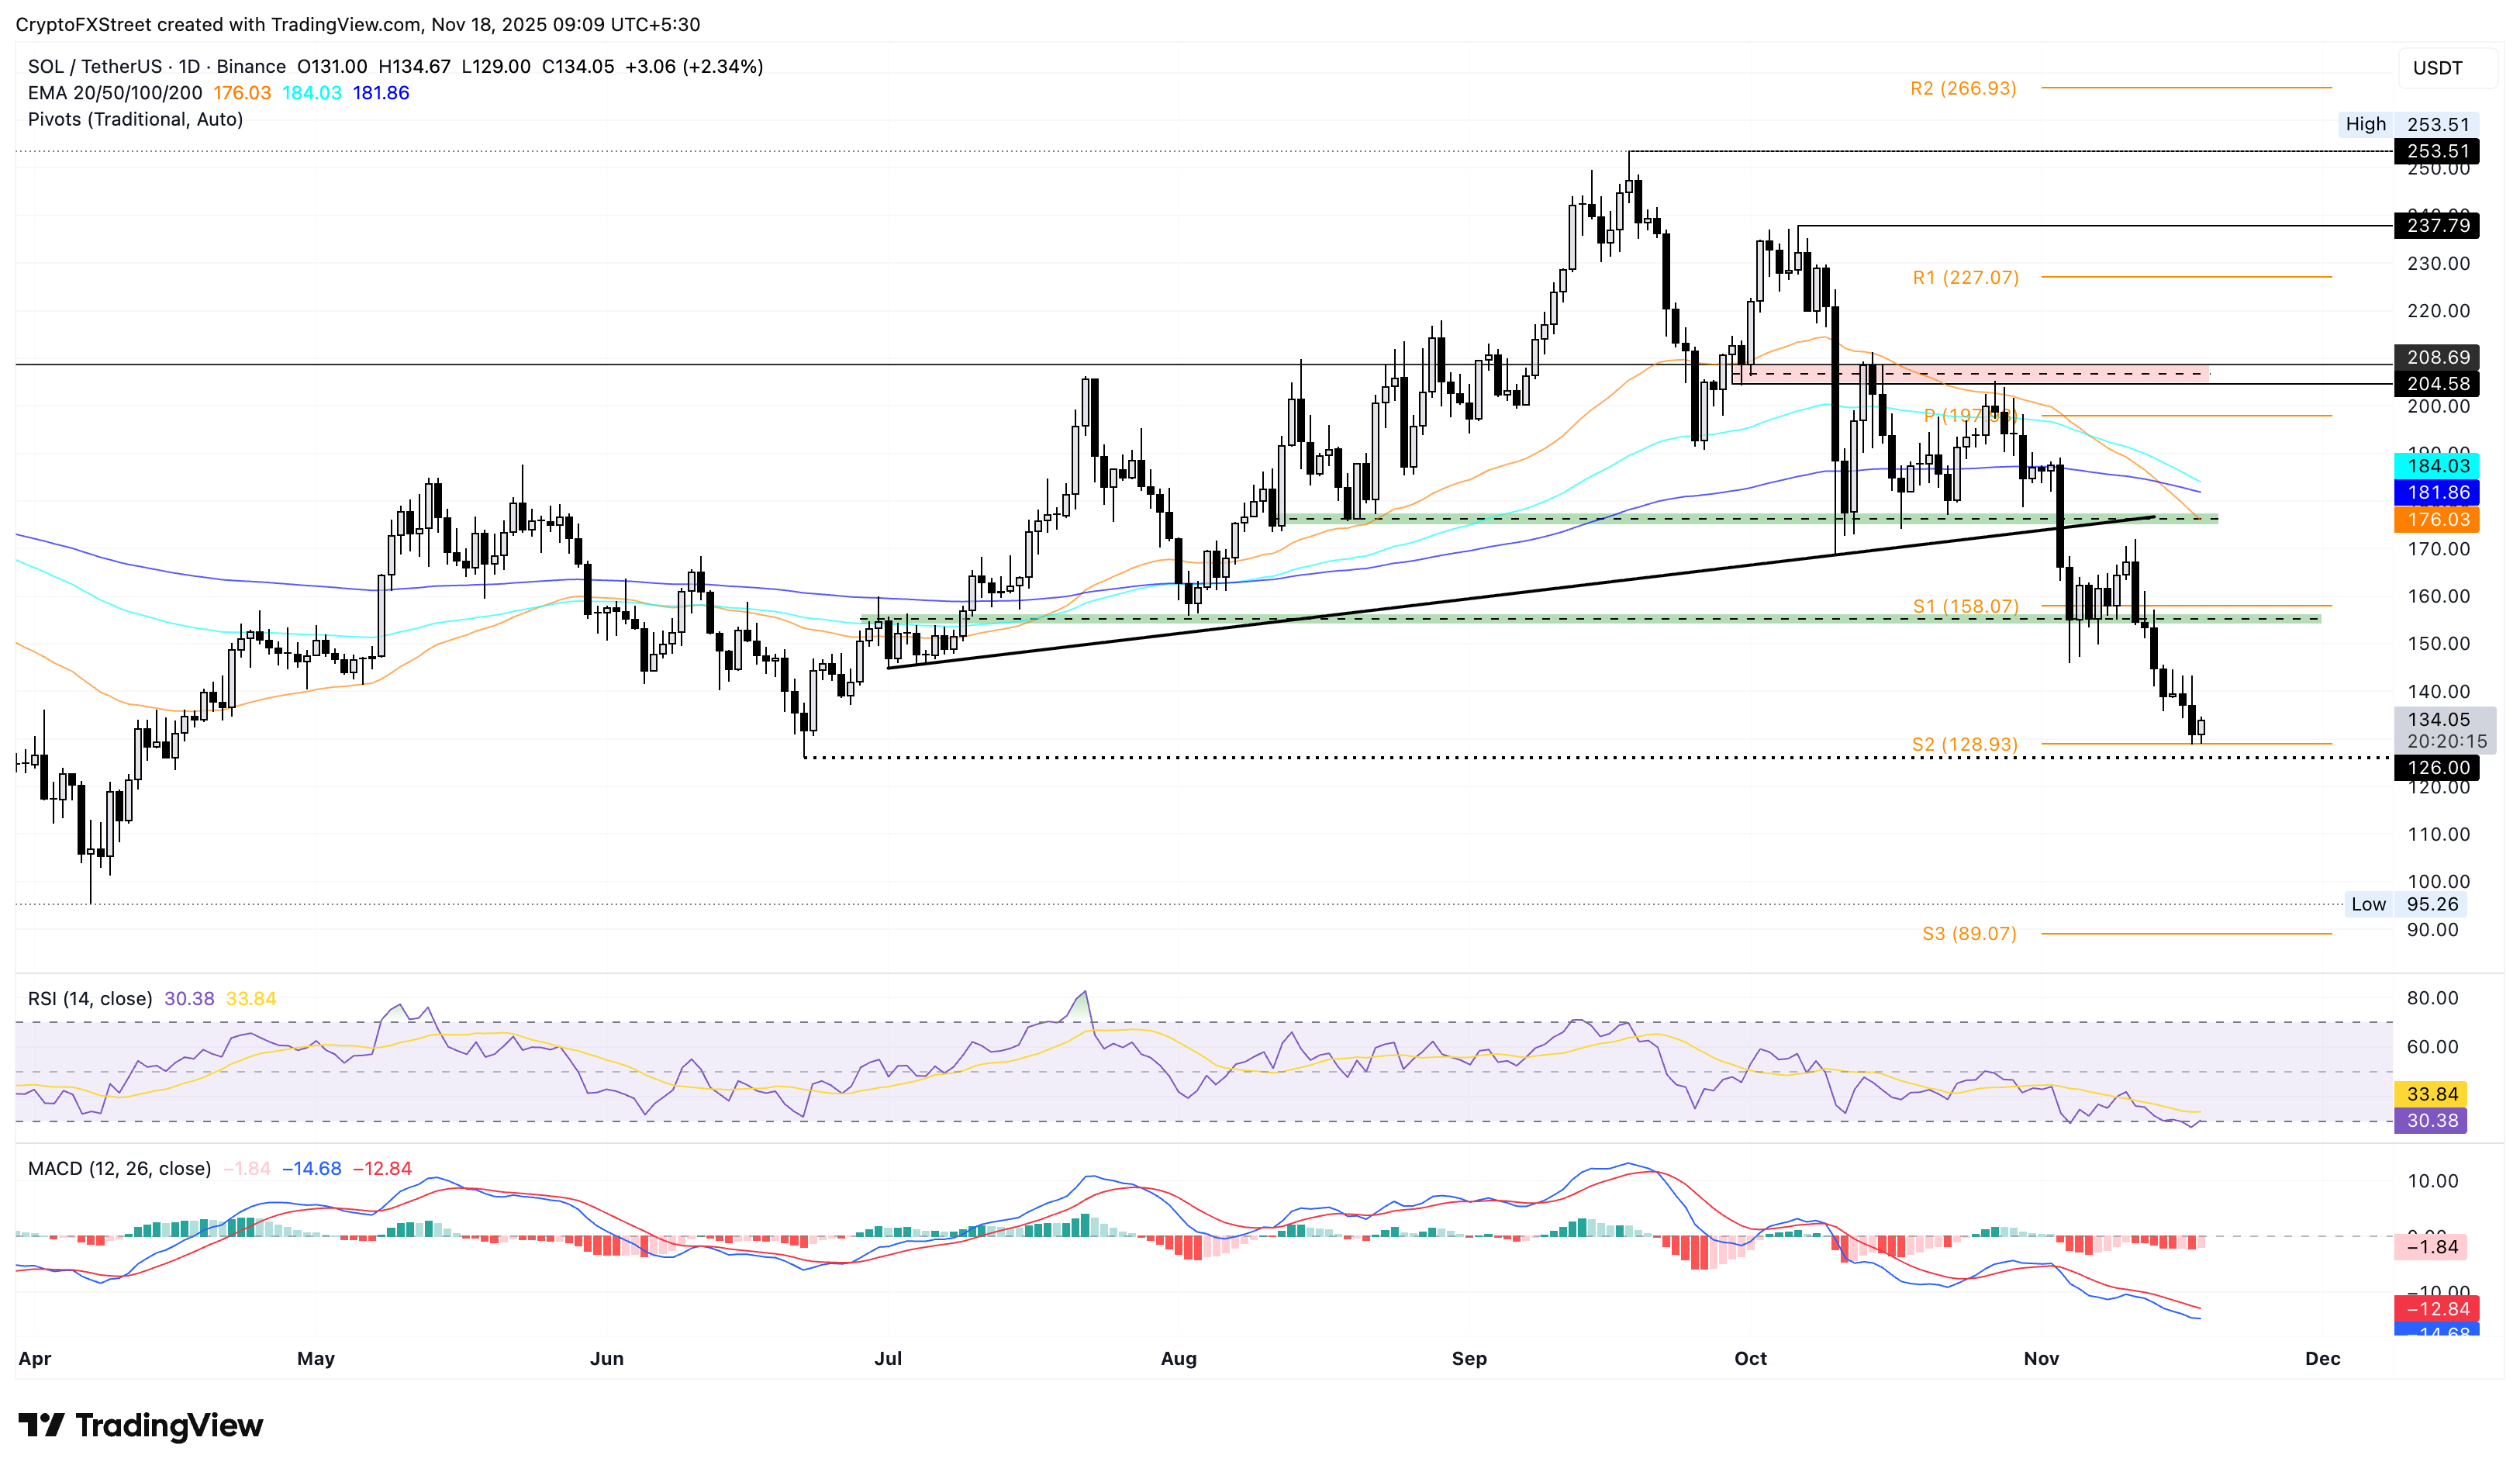
If SOL drops below $126, it would nullify rebound chances and likely test the April 7 low of $95.
Related Articles
Amazon Stock Predictions for 2026 to 2030: Will They Exceed Expectations and Achieve Major Long-Term Goals?
TradingKey - As we head into 2026, many investors are questioning where Amazon (AMZN) fits into the technology world.
A Crash After a Surge: Why Silver Lost 40% in a Week?
TradingKey - Spot silver (XAGUSD) prices continue to decline. Silver plunged 20% on Thursday, breaking below $71 per ounce, with the sell-off intensifying on Friday as prices fell further below $64. Compared to the all-time high set on January 29, silver prices have retraced more than 40%, wiping out nearly all gains accumulated over the previous month.
Google Cloud Revenue Surges 48% in Q4 as CapEx Guidance Nearly Doubles: Why the 7.5% After-Hours Dip?
TradingKey - After the close on February 4 (ET), Google (GOOG, GOOGL) released stellar Q4 results: total revenue grew 18% year-over-year, hitting a new quarterly record after revenue first surpassed $100 billion in Q3. The primary highlight was Google Cloud, where Q4 revenue surged 48% year-over-yea
Is Bitcoin’s Four-Year Cycle Dead in 2026?
Is the Bitcoin 4-year cycle dead? After 2025 broke historical records with a red post-halving year, institutional analysts explore if the Bitcoin price has decoupled from the halving countdown. Analyze the impact of spot ETFs, global liquidity, and the roadmap to the 2028 halving in this 2026 market

