

Zcash, Filecoin, and Uniswap lead losses as Bitcoin drops to $103,000

- Zcash extends a double top breakout amid intense selling pressure.
- Filecoin marks its fifth consecutive day of losses, risking the gains made last week.
- Uniswap reverses from the $10 mark, holding above the 200-day EMA.
Zcash (ZEC), Filecoin (FIL), and Uniswap (UNI) record double-digit losses on Wednesday as Bitcoin (BTC) drops to $103,000. The altcoins outpace the broader cryptocurrency market in losses over the last 24 hours, losing the recent gains. The technical outlook remains bearish, flagging a risk of further correction.
Zcash risks losses below $400
Zcash trades below $450 at press time on Wednesday, crossing below the 100-period Exponential Moving Average (EMA) on the 4-hour chart. The privacy coin extends the breakout double top pattern formed near $682 high from Monday, with a neckline close to the $500 psychological level.
Zcash’s declining trend targets the 200-period EMA at $372 as immediate support, risking the $400 round figure.
The Relative Strength Index (RSI) reads 37 on the 4-hour chart, sloping downwards, with further room for correction before hitting the oversold boundary. This indicates a steady sell pressure as the broader market corrects.
Meanwhile, the Moving Average Convergence Divergence (MACD) treads deeper waters below the zero line, signaling an intense bearish momentum.
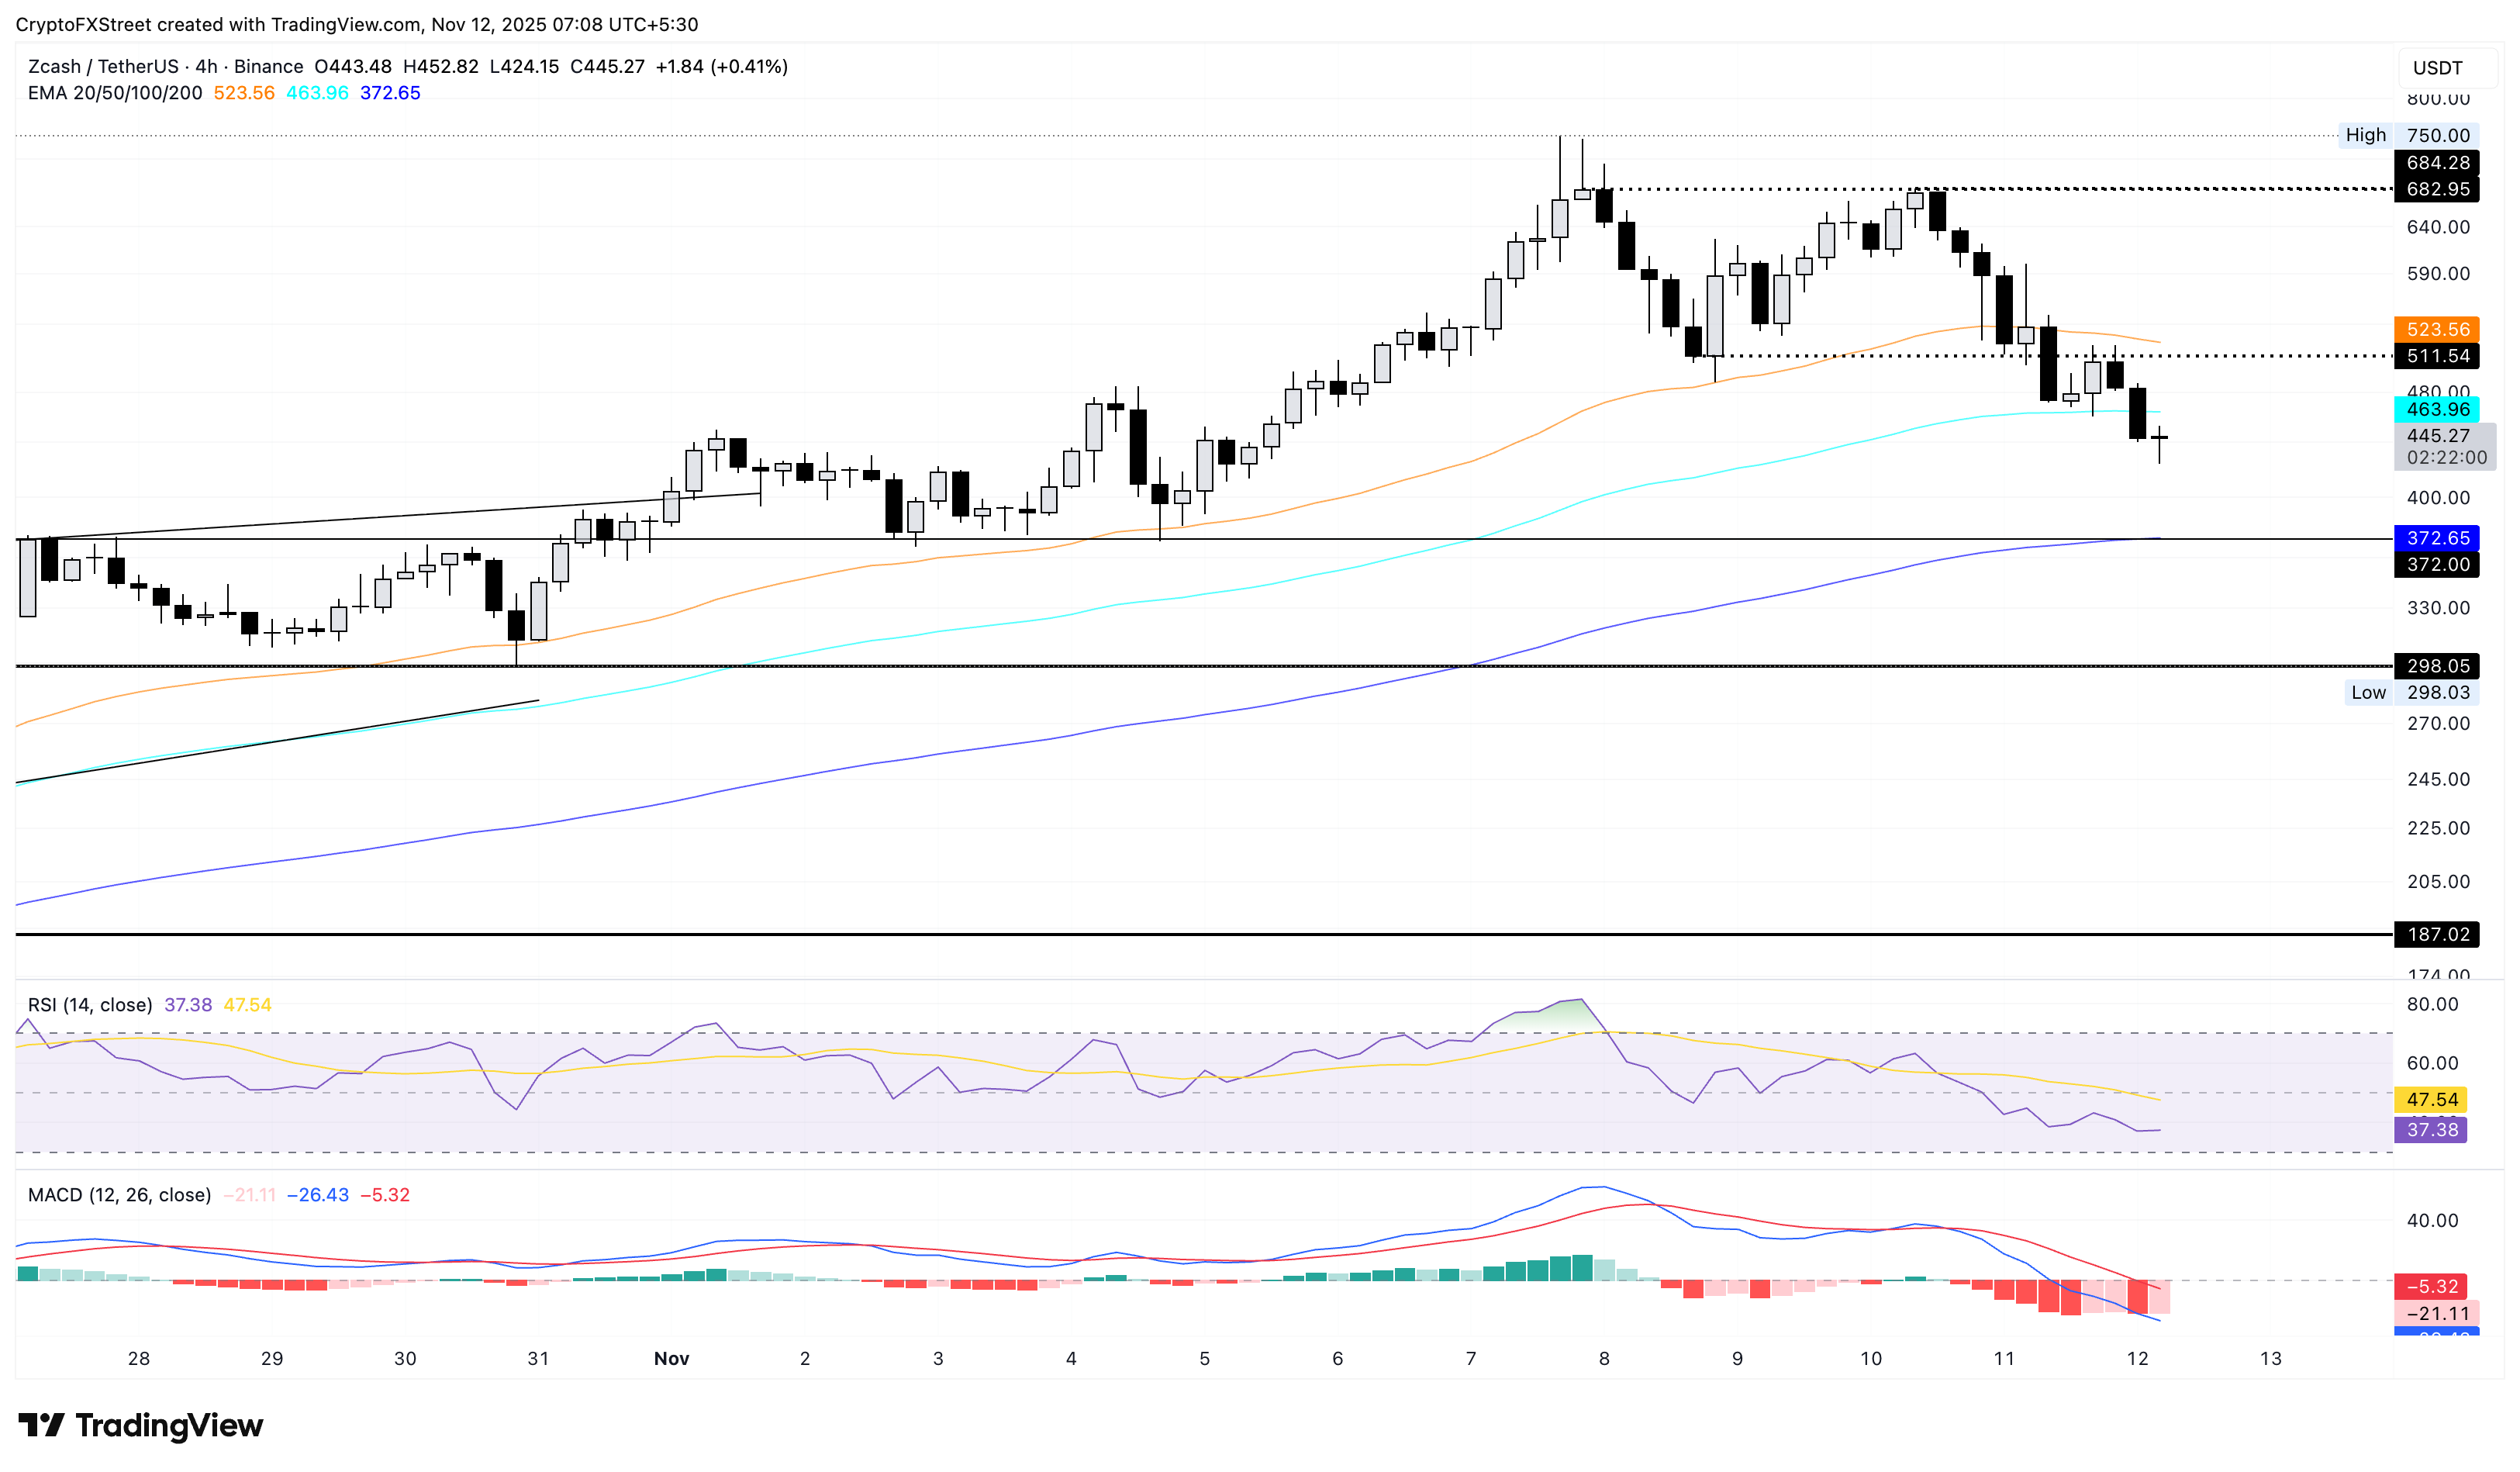
Looking up, if ZEC reclaims the 50-period EMA at $523, it would nullify the double top pattern, potentially extending the recovery to the $600 round figure.
Filecoin’s declining trend aims to break below the 50-day EMA
Filecoin dropped below the 200-day EMA at $2.45 on Tuesday, extending a steady decline after the 79% rally on Friday. At the time of writing, FIL marks the fifth consecutive day of losses with a 1% decline as of Wednesday.
The pullback phase threatens the 50-day EMA at the $2.00 psychological level. If FIL drops below this level, it could extend the decline to the $1.27 low from November 4.
The RSI is at 53, retracing from the overbought zone and indicating a sharp reduction in the buying pressure. If RSI drops below 50, it could confirm a sell-side dominance.
At the same time, the MACD shifts downside, risking a crossover with the signal line, which could confirm renewed bearish momentum.
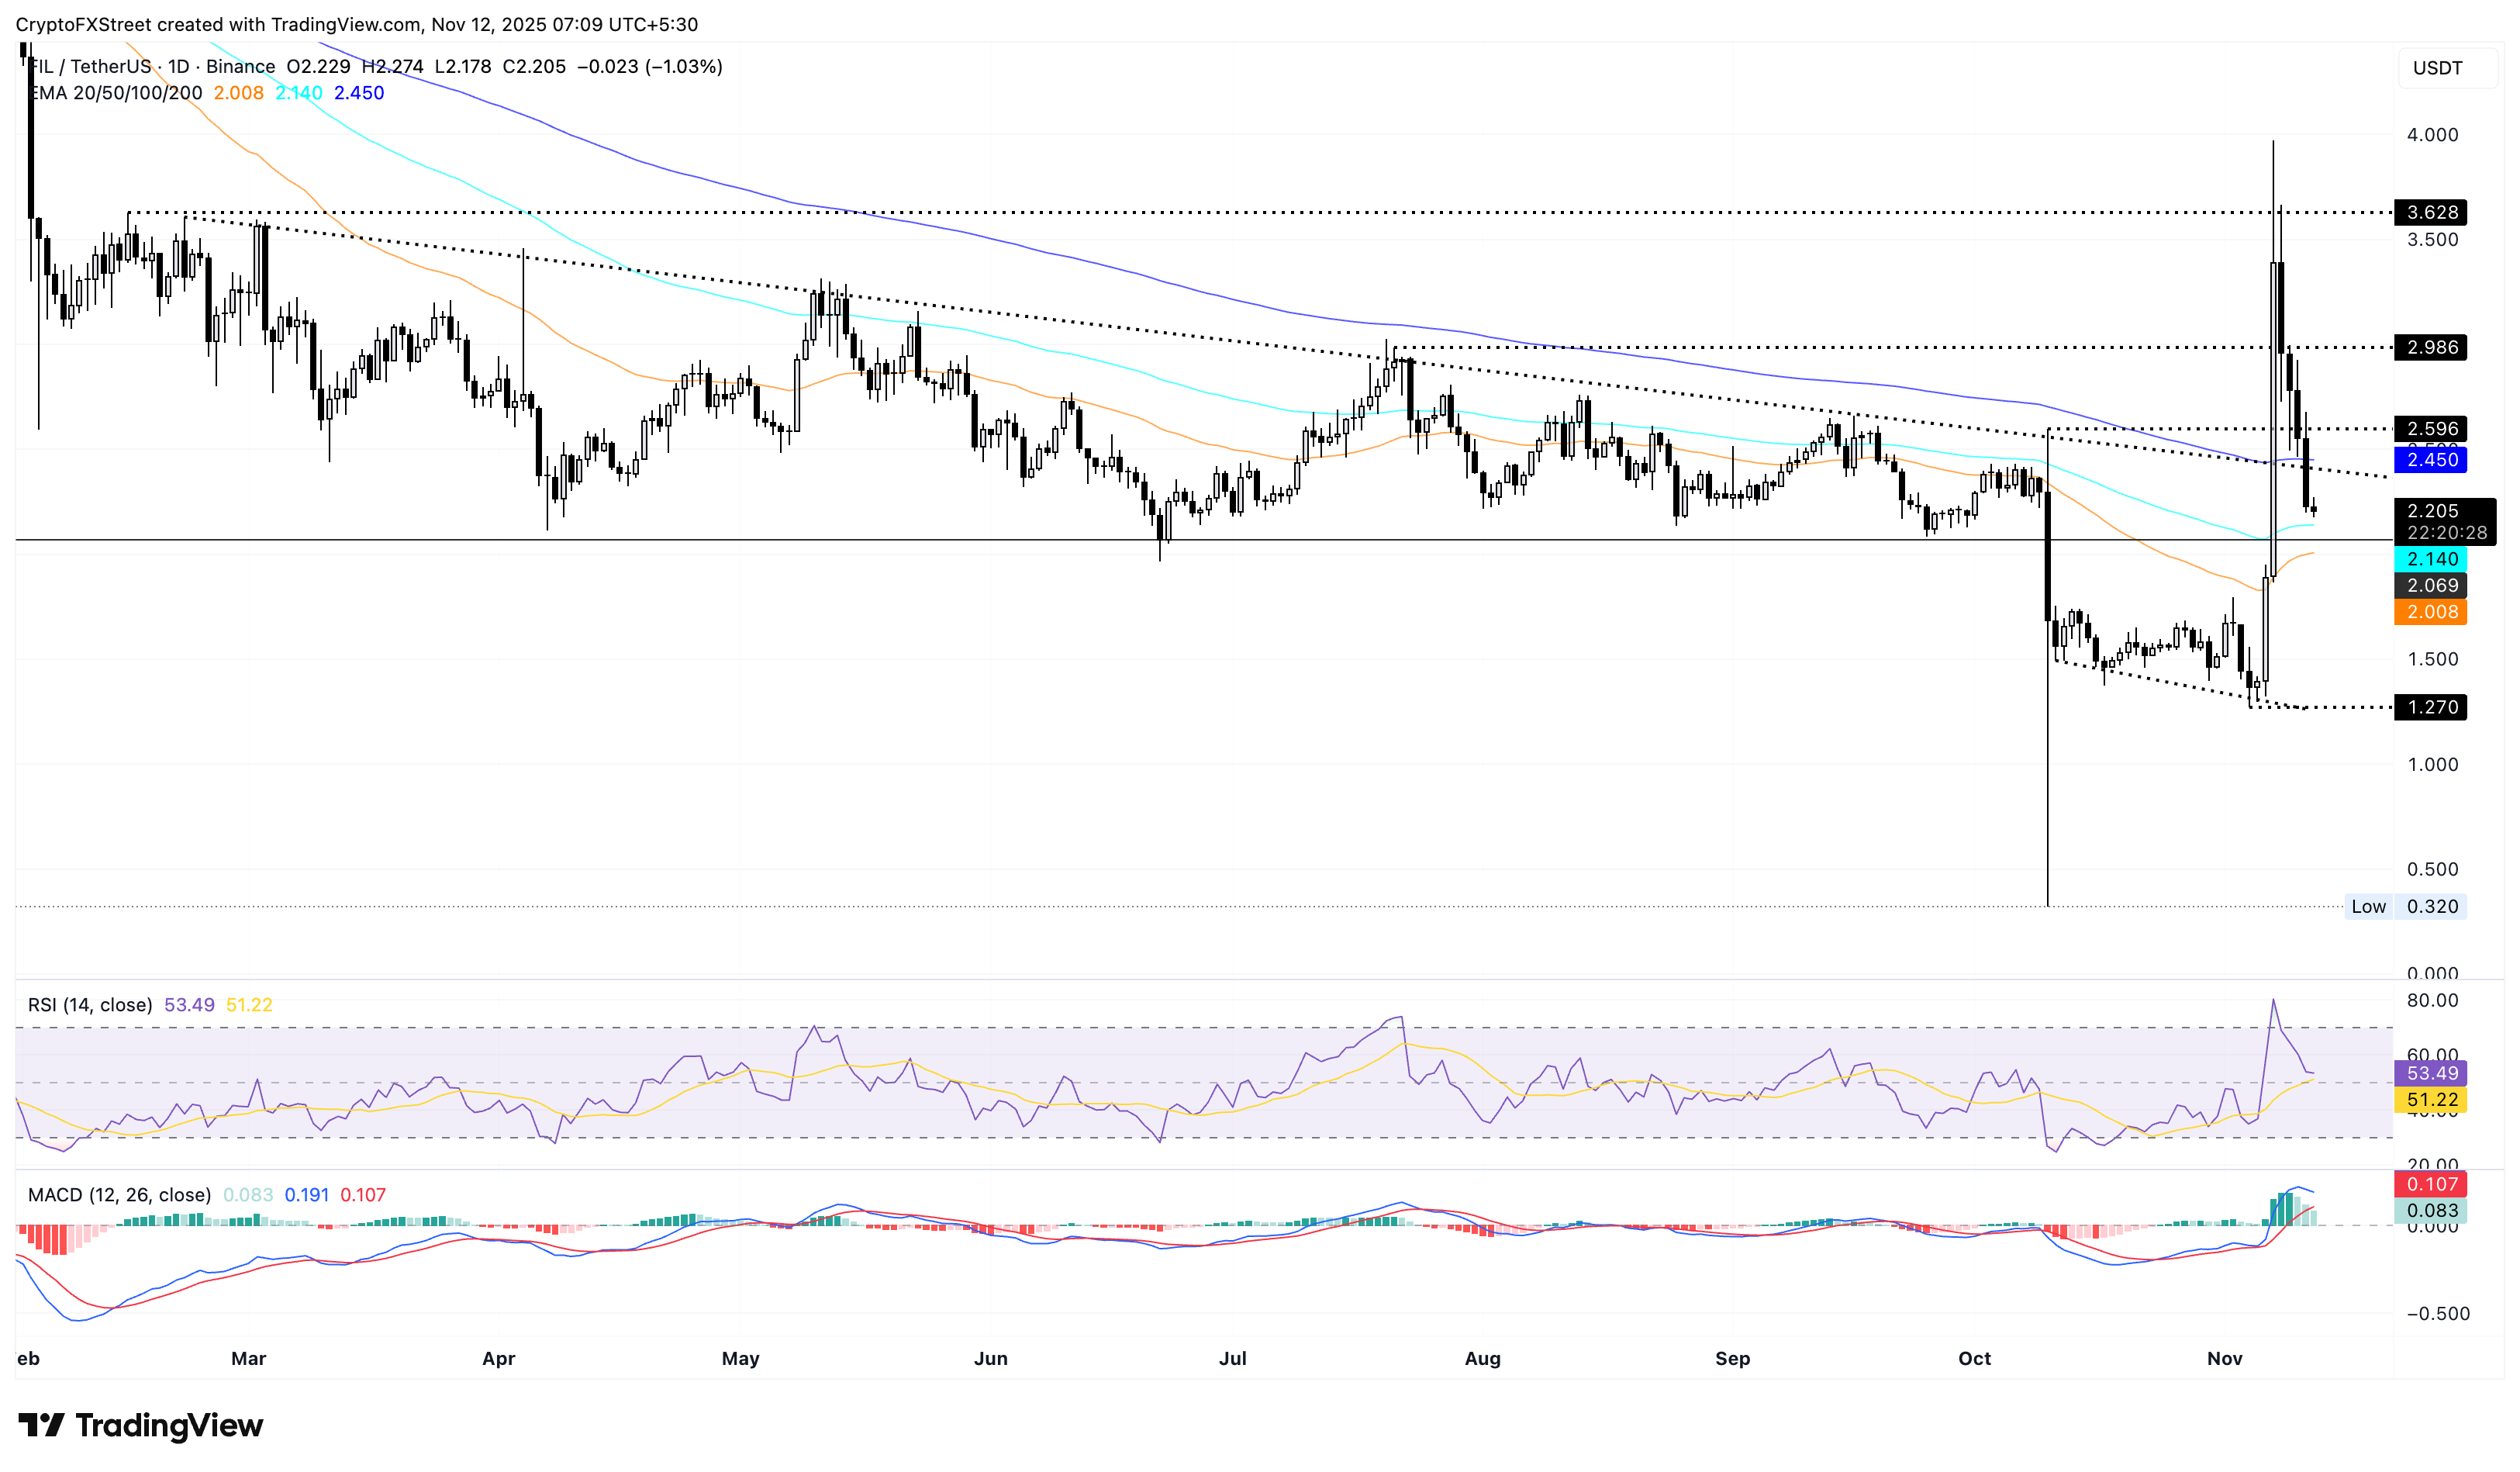
However, a potential bounce back in FIL from the 100-period EMA at $2.14 could test the 200-day EMA at $2.45.
Uniswap’s pullback approaches the 200-day EMA
Uniswap approaches the 200-day EMA at $7.992 after an 11% pullback on Tuesday, which ended the four-day streak of the uptrend. The Decentralized Exchange (DEX) token could extend its decline to the 50-day EMA at $7.02 if it loses support from the 200-day EMA.
The RSI at 63 retraces from the overbought zone, indicating a decline in buying pressure. Still, the relatively high values suggest a significant bullish inclination that could hold prices at key support levels.
Adding to the optimism, the MACD maintains a steady upward trend, with the signal line and successively rising green histogram bars, indicating an increase in bullish momentum.
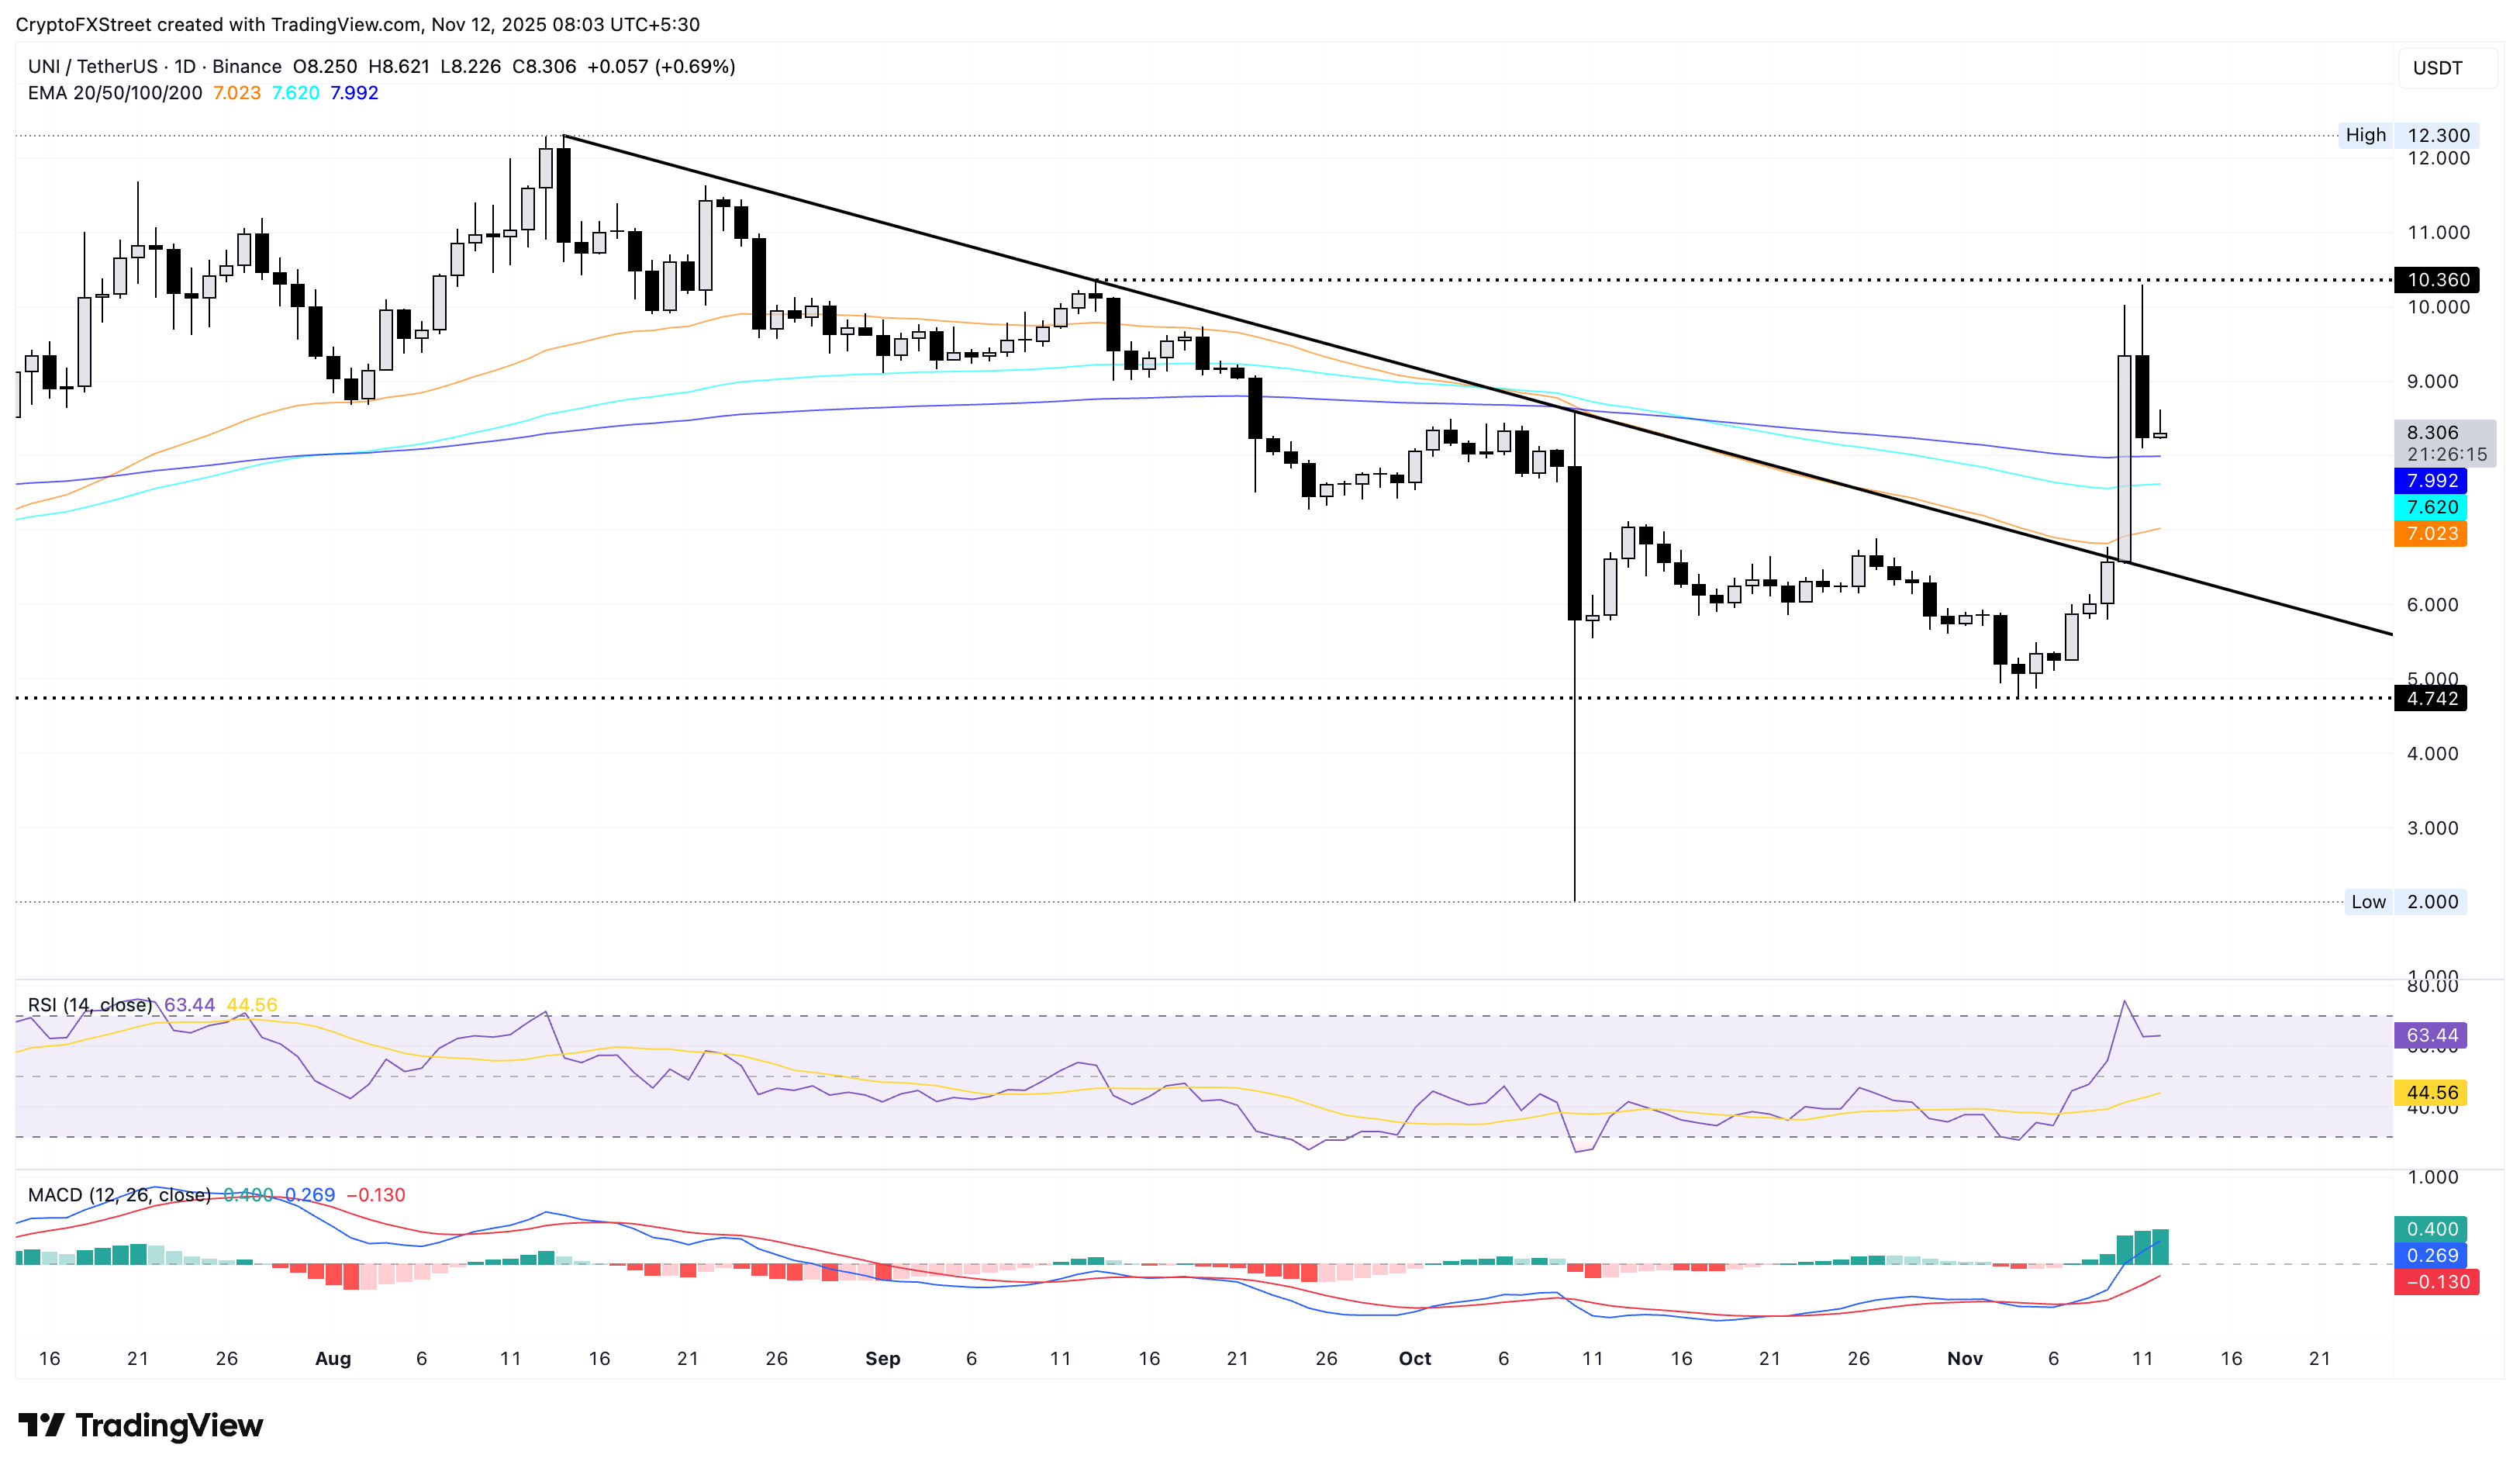
If UNI regains strength, a bounce back from the 200-day EMA could rechallenge the $10 psychological resistance.
Recommended Articles


Comments (0)
Click the $ button, enter the symbol, and select to link a stock, ETF, or other ticker.