

Hyperliquid Price Forecast: HYPE under pressure as bearish sentiment persists

- Hyperliquid price hovers $37.34 on Thursday after falling nearly 6% so far this week.
- Derivatives data point to weakening market sentiment, with open interest falling and funding rates turning negative.
- The technical outlook signals potential for further downside if HYPE closes below the key $36.51 support level.
Hyperliquid (HYPE) price hovers around $37 on Thursday, having corrected 6% so far this week. The selling pressure continues to weigh on the HYPE price as bearish sentiment builds across the derivatives market. Falling open interest and negative funding rates point to weakening trader confidence. At the same time, technical indicators suggest the risk of a deeper pullback if the HYPE fails to hold its key support level.
Derivatives data lean bearish
Derivatives data for Hyperliquid support a bearish outlook. Coinglass’s OI-Weighted Funding Rate data shows that the number of traders betting that the price of Hyperliquid will slide further is higher than those anticipating a price increase.
The metric has flipped to a negative rate and reads -0.014% on Thursday, nearing the level seen during last week's massive price dips. The negative ratio suggests that shorts are paying longs, indicating a bearish sentiment for HYPE.
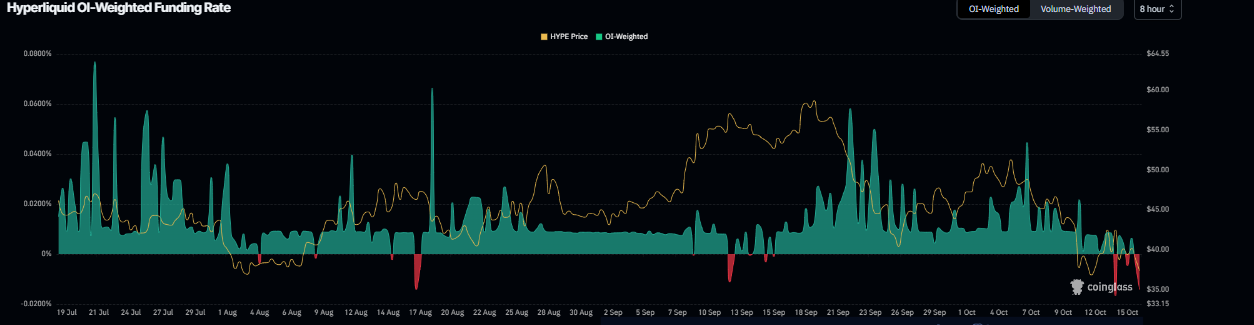
HYPE funding rate chart. Source: Coinglass
Apart from negative funding rates, the futures Open Interest (OI) dropped to $163.28 million on Thursday, reaching levels not seen since early September, reflecting waning investor participation.
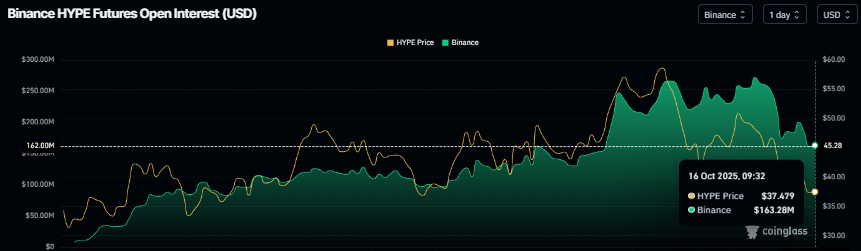
HYPE open interest chart. Source: Coinglass
Hyperliquid Price Forecast: Will HYPE drop to June’s low?
Hyperliquid price found support around the weekly level at $36.51 on Sunday and recovered 15% the next day. However, the price recovery came to an end as HYPE faced rejection around the 61.8% Fibonacci retracement level at $44.48, erasing most of its gains by Wednesday. At the time of writing on Thursday, HYPE hovers at $37.34, nearing the weekly support at $36.51.
If HYPE continues its correction and closes below the weekly support at $36.51 on a daily basis, it could extend the correction toward the June 21 low of $30.92.
The Relative Strength Index (RSI) indicator at 37 on the daily chart suggests that bearish momentum is gaining traction. Additionally, the Moving Average Convergence Divergence (MACD) showed a bearish crossover on October 6, which still holds, further supporting the bearish view.
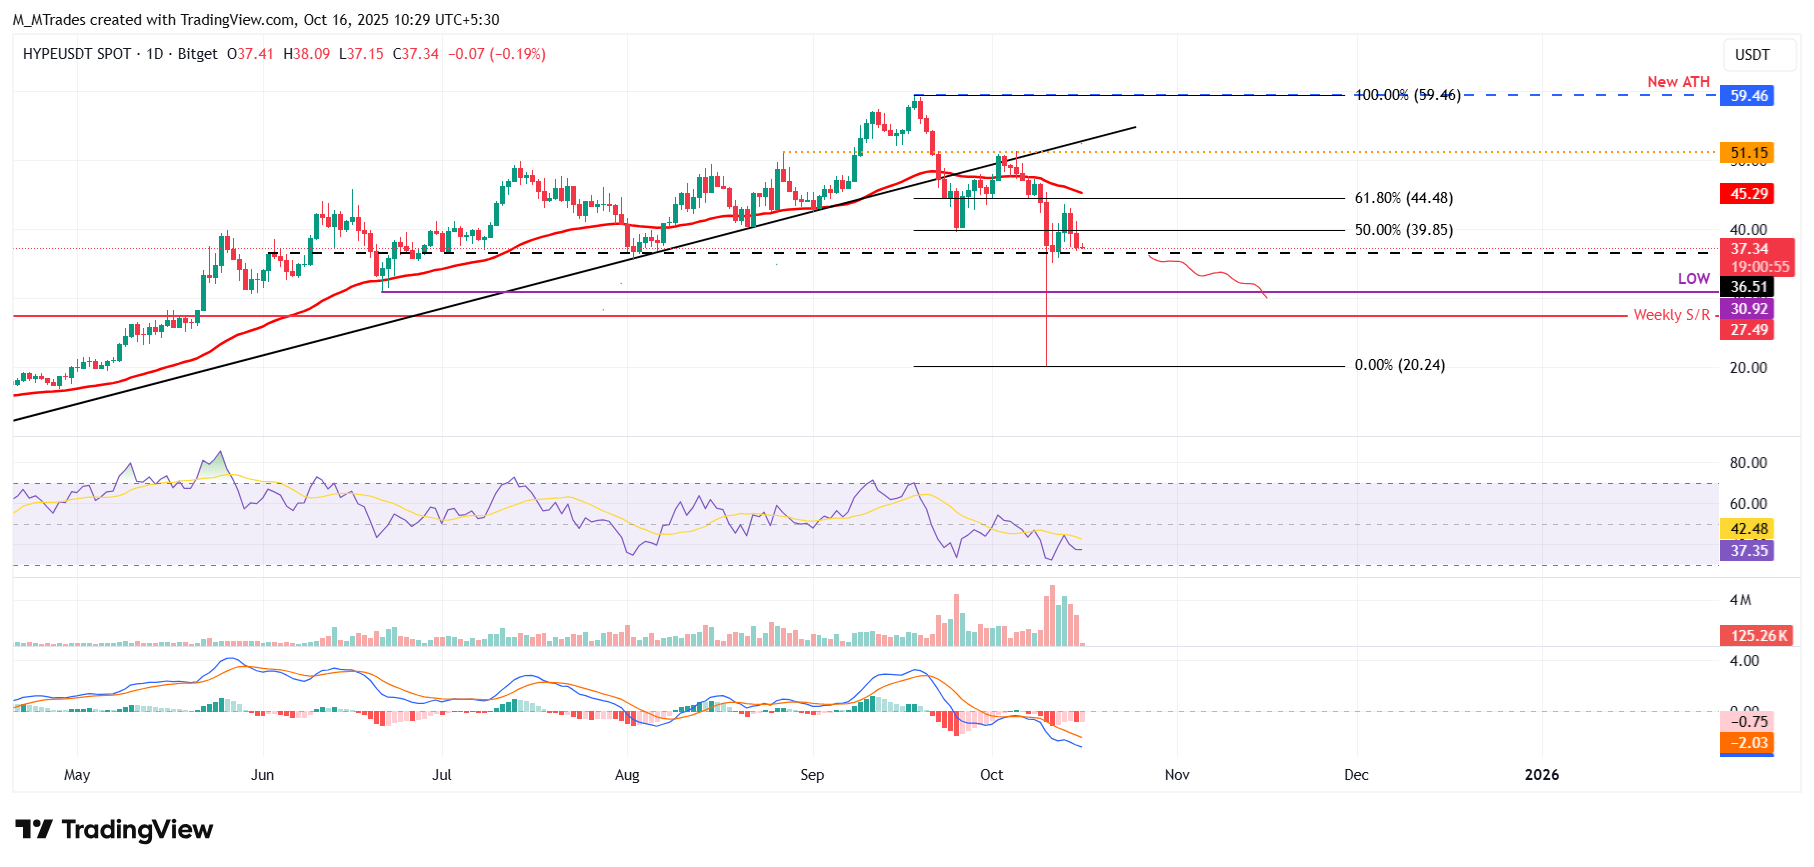
HYPE/USDT daily chart
However, if HYPE finds support around the weekly level at $36.51 and recovers, it could extend the recovery toward the 50-day Exponential Moving Average (EMA) at $45.29.
Related Articles
$660B Capex Bill Triggers $900B Wipeout: Why Apple Shares Outperform Amazon and Google Despite AI Lag
Based on financial disclosures, the combined 2026 capital expenditure forecasts for Meta, Amazon, Google, and Microsoft are projected to reach $660 billion. This figure is not only significantly higher than the $410 billion forecast for 2025 and $245 billion for 2024, but even surpasses the GDP of I
Amazon Stock Predictions for 2026 to 2030: Will They Exceed Expectations and Achieve Major Long-Term Goals?
TradingKey - As we head into 2026, many investors are questioning where Amazon (AMZN) fits into the technology world.
A Crash After a Surge: Why Silver Lost 40% in a Week?
TradingKey - Spot silver (XAGUSD) prices continue to decline. Silver plunged 20% on Thursday, breaking below $71 per ounce, with the sell-off intensifying on Friday as prices fell further below $64. Compared to the all-time high set on January 29, silver prices have retraced more than 40%, wiping out nearly all gains accumulated over the previous month.
Is Bitcoin’s Four-Year Cycle Dead in 2026?
Is the Bitcoin 4-year cycle dead? After 2025 broke historical records with a red post-halving year, institutional analysts explore if the Bitcoin price has decoupled from the halving countdown. Analyze the impact of spot ETFs, global liquidity, and the roadmap to the 2028 halving in this 2026 market

