

Top 3 Price Prediction: Bitcoin, Ethereum, Ripple – BTC, ETH, and XRP stage mild recovery after sharp correction

- Bitcoin price hovers around $115,500 on Monday, rebounding after dipping to a low of $102,000 on Friday.
- Ethereum trades above $4,100 after finding support around a key level.
- XRP stabilizes near $2.57 after a 15% decline last week, hinting at easing selling pressure.
Bitcoin (BTC), Ethereum (ETH) and Ripple (XRP) prices are showing signs of stabilization at the start of the week on Monday as these top three cryptocurrencies recovered slightly from last week’s steep losses. BTC hovers around $115,500, while ETH and XRP trade above $4,100 and $2.57, respectively, with traders cautiously returning to the market amid improving sentiment.
Bitcoin recovers after massive dip
Bitcoin price faced rejection after reaching a new all-time high of $126,199 on October 6. It then declined, reaching a daily low of $102,000 on Friday and fell more than 11% from Tuesday's high to Saturday's low. However, BTC recovered slightly on Sunday, closing above 114,900. At the time of writing on Monday, it hovers at around $115,500.
If BTC continues its recovery, it could retest its key psychological level at $120,000.
The Relative Strength Index (RSI) on the daily chart reads 48, nearing the neutral level of 50, indicating fading bearish momentum. However, the Moving Average Convergence Divergence (MACD) indicators still showed a bearish crossover on the daily chart, suggesting bearish momentum.
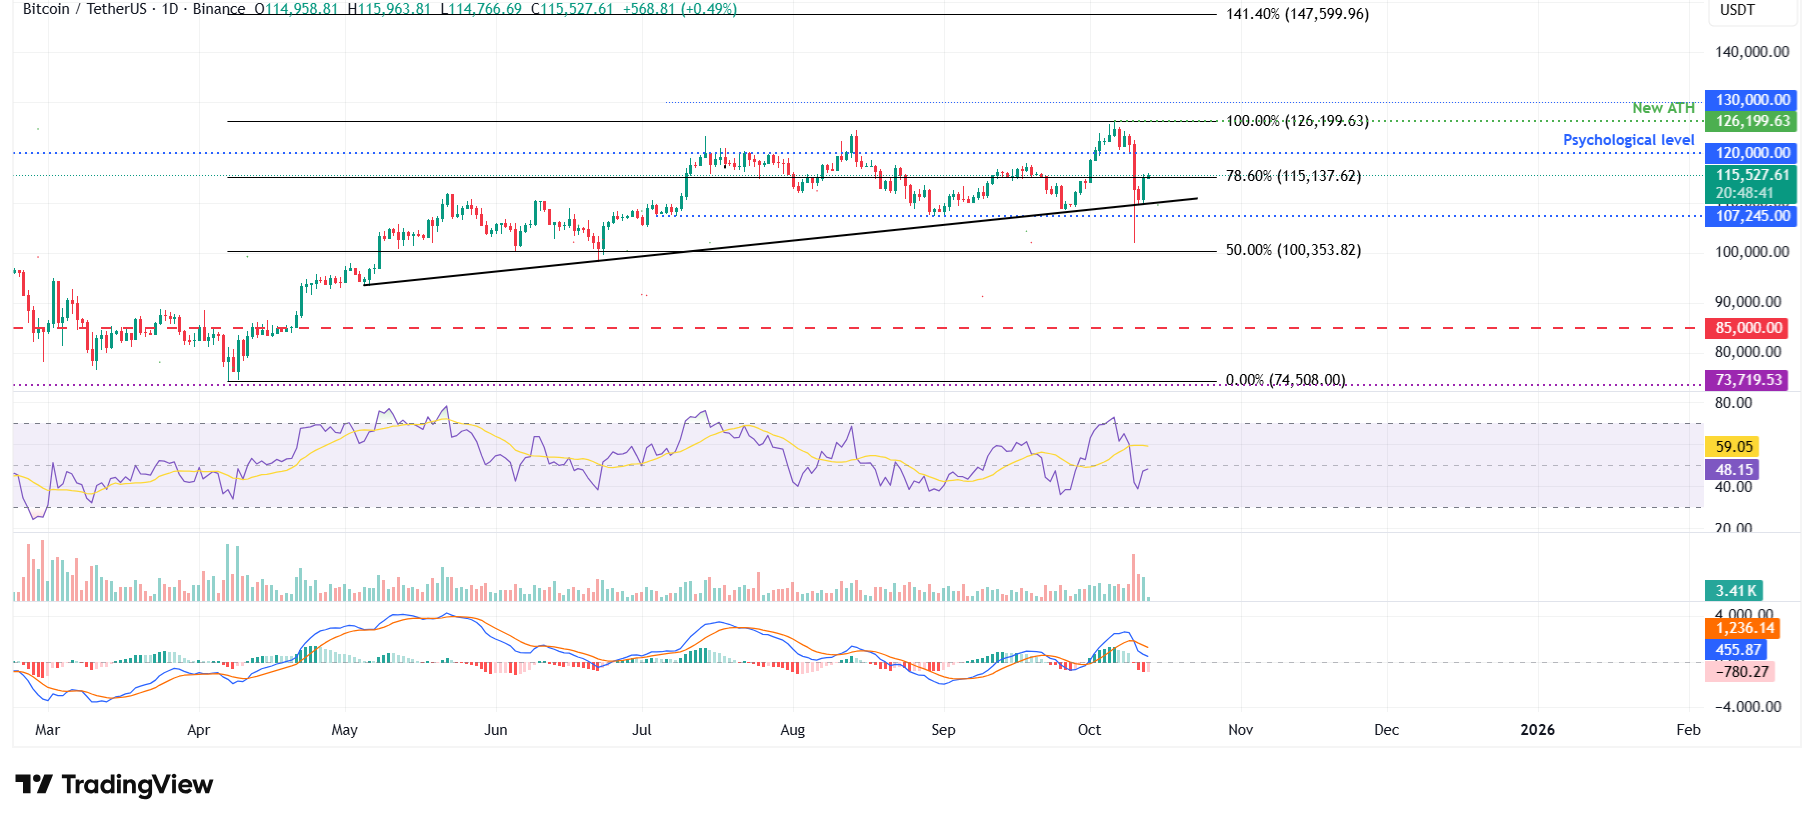
BTC/USDT daily chart
However, if BTC faces a correction, it could extend the decline toward the daily support at $107,245.
Ethereum could extend its recovery if it closes above $4,232 resistance
Ethereum price failed to find support around the daily level at $4,488 on October 7 and declined 17.66% until Saturday. On Sunday, ETH recovered slightly, closing above $4,150. At the time of writing on Monday, it hovers at around $4,160.
If ETH continues its recovery and closes above the daily resistance at $4,232, it could extend the rally toward the next daily resistance at $4,488.
Like Bitcoin, Ethereum’s RSI on the daily chart shows fading bearish momentum, while MACD still supports the bearish view.
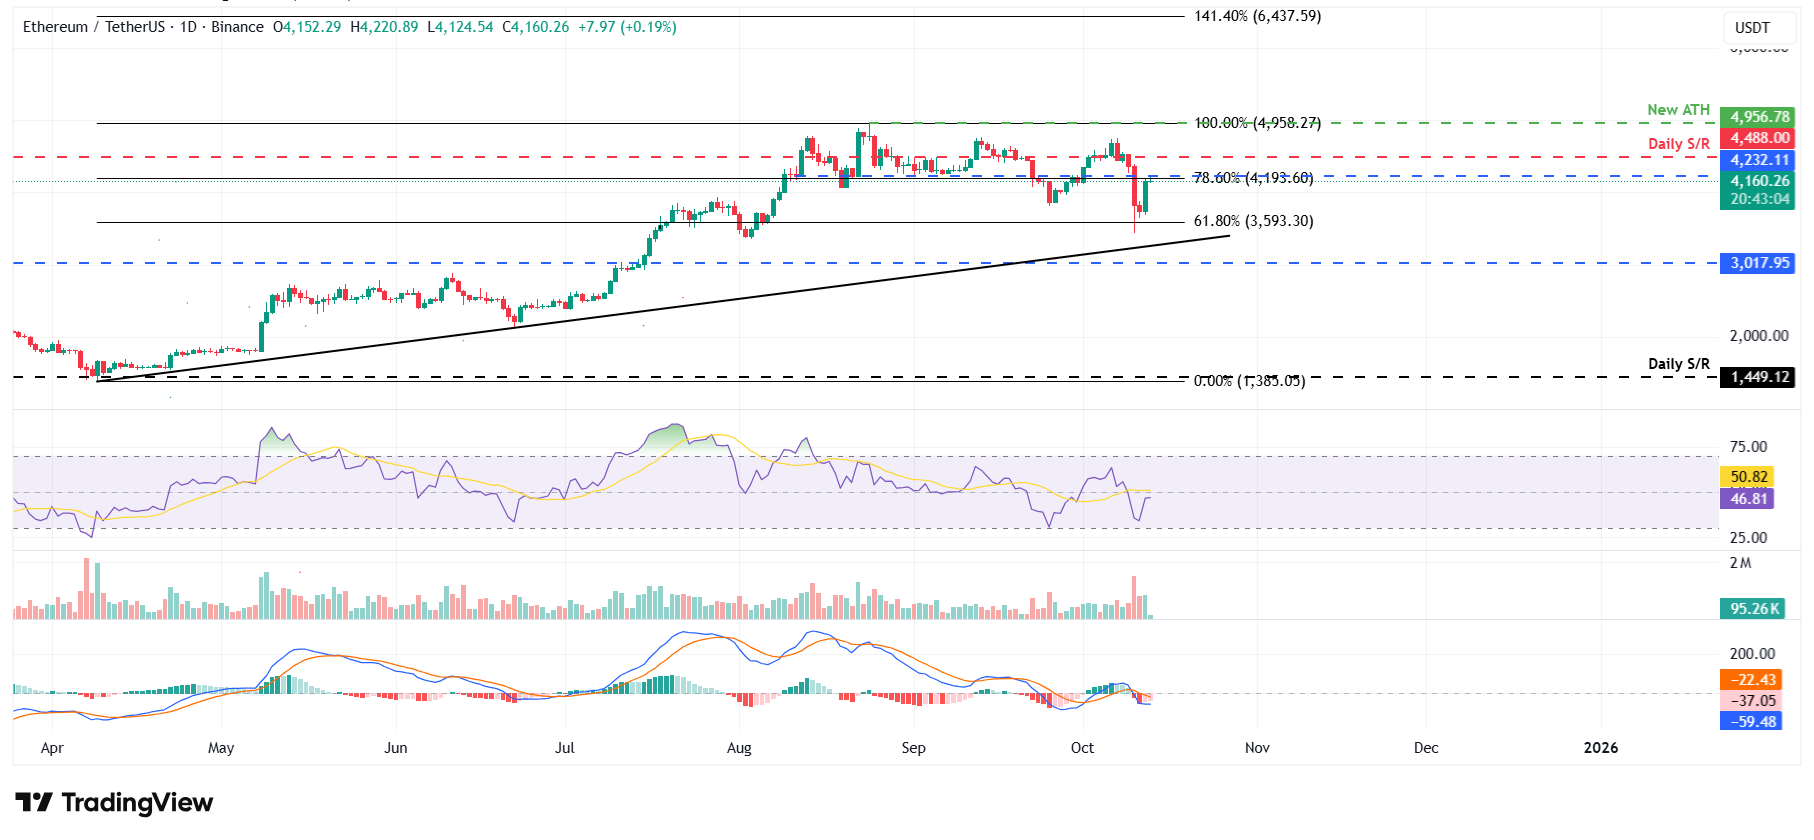
ETH/USDT daily chart
However, if ETH faces a correction, it could extend the decline toward the 61.8% Fibonacci retracement level at $3,593.
XRP could extend its recovery toward $2.72
Ripple price faced rejection from the upper trendline of the falling wedge pattern on October 5 and declined more than 20% by Friday, reaching a low of $1.25. The next day, XRP recovered slightly by 6.78% until Sunday. At the time of writing on Monday, it hovers at around $2.57.
If XRP continues its recovery, it could extend the rally toward the daily resistance level at $2.72.
Like BTC and ETH, XRP’s RSI on the daily chart shows fading bearish momentum, while MACD still supports the bearish view.
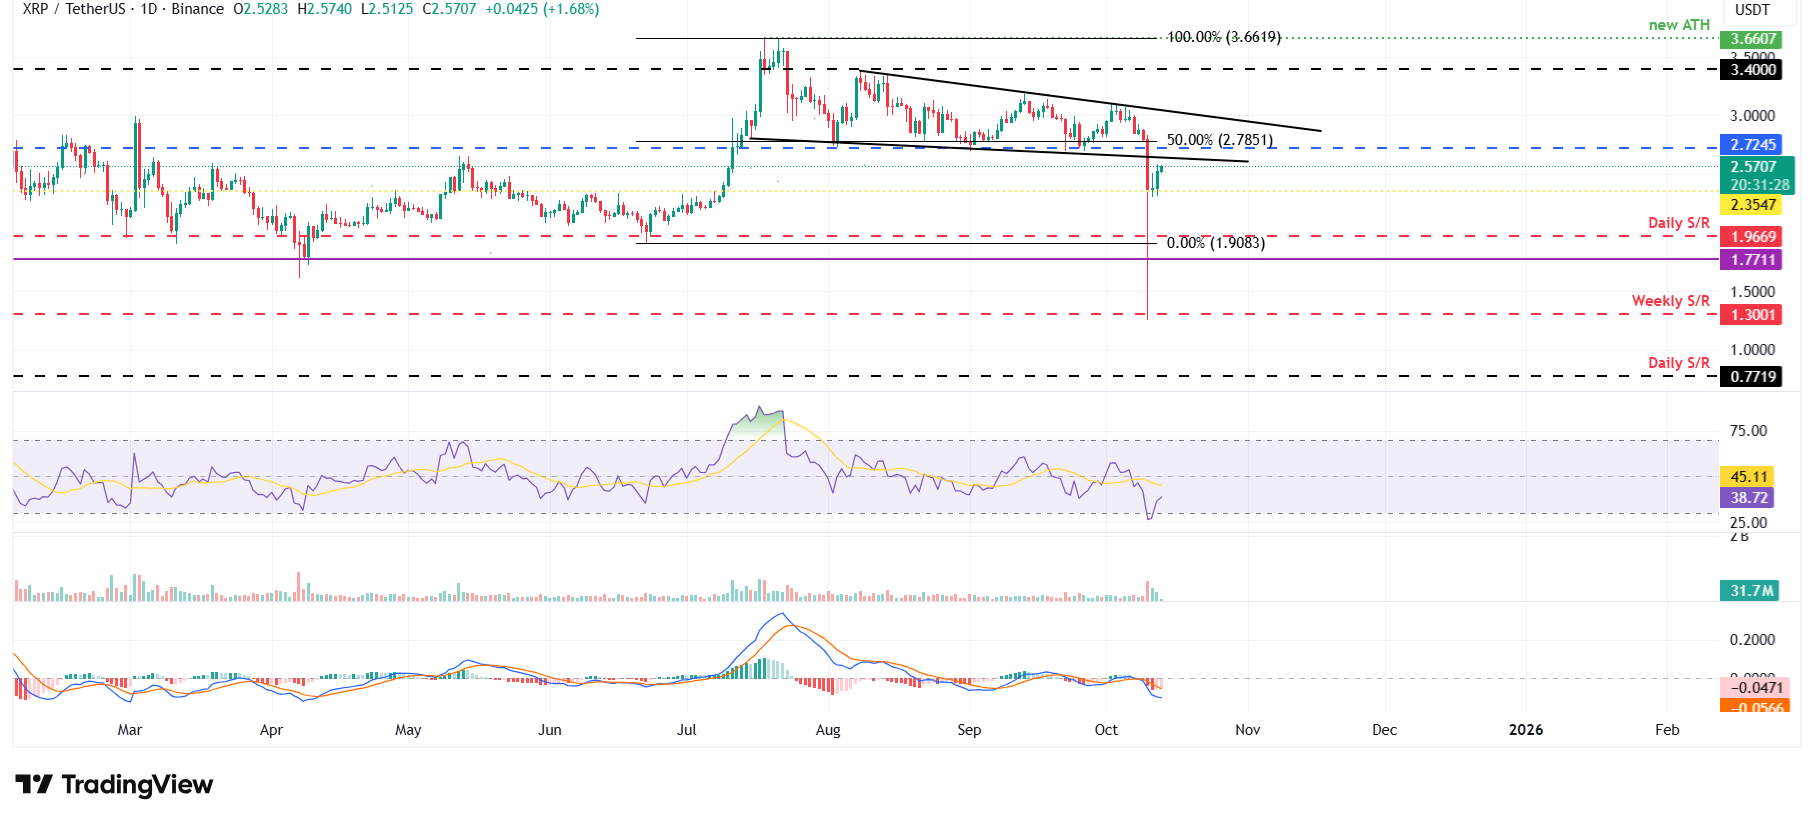
XRP/USDT daily chart
However, if XRP faces a correction, it could extend the decline toward the daily support at $2.35.
Cryptocurrency metrics FAQs
The developer or creator of each cryptocurrency decides on the total number of tokens that can be minted or issued. Only a certain number of these assets can be minted by mining, staking or other mechanisms. This is defined by the algorithm of the underlying blockchain technology. On the other hand, circulating supply can also be decreased via actions such as burning tokens, or mistakenly sending assets to addresses of other incompatible blockchains.
Market capitalization is the result of multiplying the circulating supply of a certain asset by the asset’s current market value.
Trading volume refers to the total number of tokens for a specific asset that has been transacted or exchanged between buyers and sellers within set trading hours, for example, 24 hours. It is used to gauge market sentiment, this metric combines all volumes on centralized exchanges and decentralized exchanges. Increasing trading volume often denotes the demand for a certain asset as more people are buying and selling the cryptocurrency.
Funding rates are a concept designed to encourage traders to take positions and ensure perpetual contract prices match spot markets. It defines a mechanism by exchanges to ensure that future prices and index prices periodic payments regularly converge. When the funding rate is positive, the price of the perpetual contract is higher than the mark price. This means traders who are bullish and have opened long positions pay traders who are in short positions. On the other hand, a negative funding rate means perpetual prices are below the mark price, and hence traders with short positions pay traders who have opened long positions.
Related Articles
$660B Capex Bill Triggers $900B Wipeout: Why Apple Shares Outperform Amazon and Google Despite AI Lag
Based on financial disclosures, the combined 2026 capital expenditure forecasts for Meta, Amazon, Google, and Microsoft are projected to reach $660 billion. This figure is not only significantly higher than the $410 billion forecast for 2025 and $245 billion for 2024, but even surpasses the GDP of I
Amazon Stock Predictions for 2026 to 2030: Will They Exceed Expectations and Achieve Major Long-Term Goals?
TradingKey - As we head into 2026, many investors are questioning where Amazon (AMZN) fits into the technology world.
A Crash After a Surge: Why Silver Lost 40% in a Week?
TradingKey - Spot silver (XAGUSD) prices continue to decline. Silver plunged 20% on Thursday, breaking below $71 per ounce, with the sell-off intensifying on Friday as prices fell further below $64. Compared to the all-time high set on January 29, silver prices have retraced more than 40%, wiping out nearly all gains accumulated over the previous month.
Is Bitcoin’s Four-Year Cycle Dead in 2026?
Is the Bitcoin 4-year cycle dead? After 2025 broke historical records with a red post-halving year, institutional analysts explore if the Bitcoin price has decoupled from the halving countdown. Analyze the impact of spot ETFs, global liquidity, and the roadmap to the 2028 halving in this 2026 market

