

Aptos Price Forecast: APT steadies amid rising stablecoin supply and retail demand

- Aptos holds steady after a 5% jump from the 200-day EMA on Sunday, extending the triangle breakout rally.
- The stablecoin supply on the Aptos network has increased by 500% over the last year.
- Record-high Open Interest signals a sharp increase in retail demand.
Aptos (APT) price is down by almost 1% at the time of writing on Monday, following the 5% gains from the previous day. The Parallel execution blockchain token is poised for further growth, driven by a breakout of the descending triangle pattern, elevated retail demand, and the rising issuance of stablecoins on the network.
Stablecoins move to the Aptos network
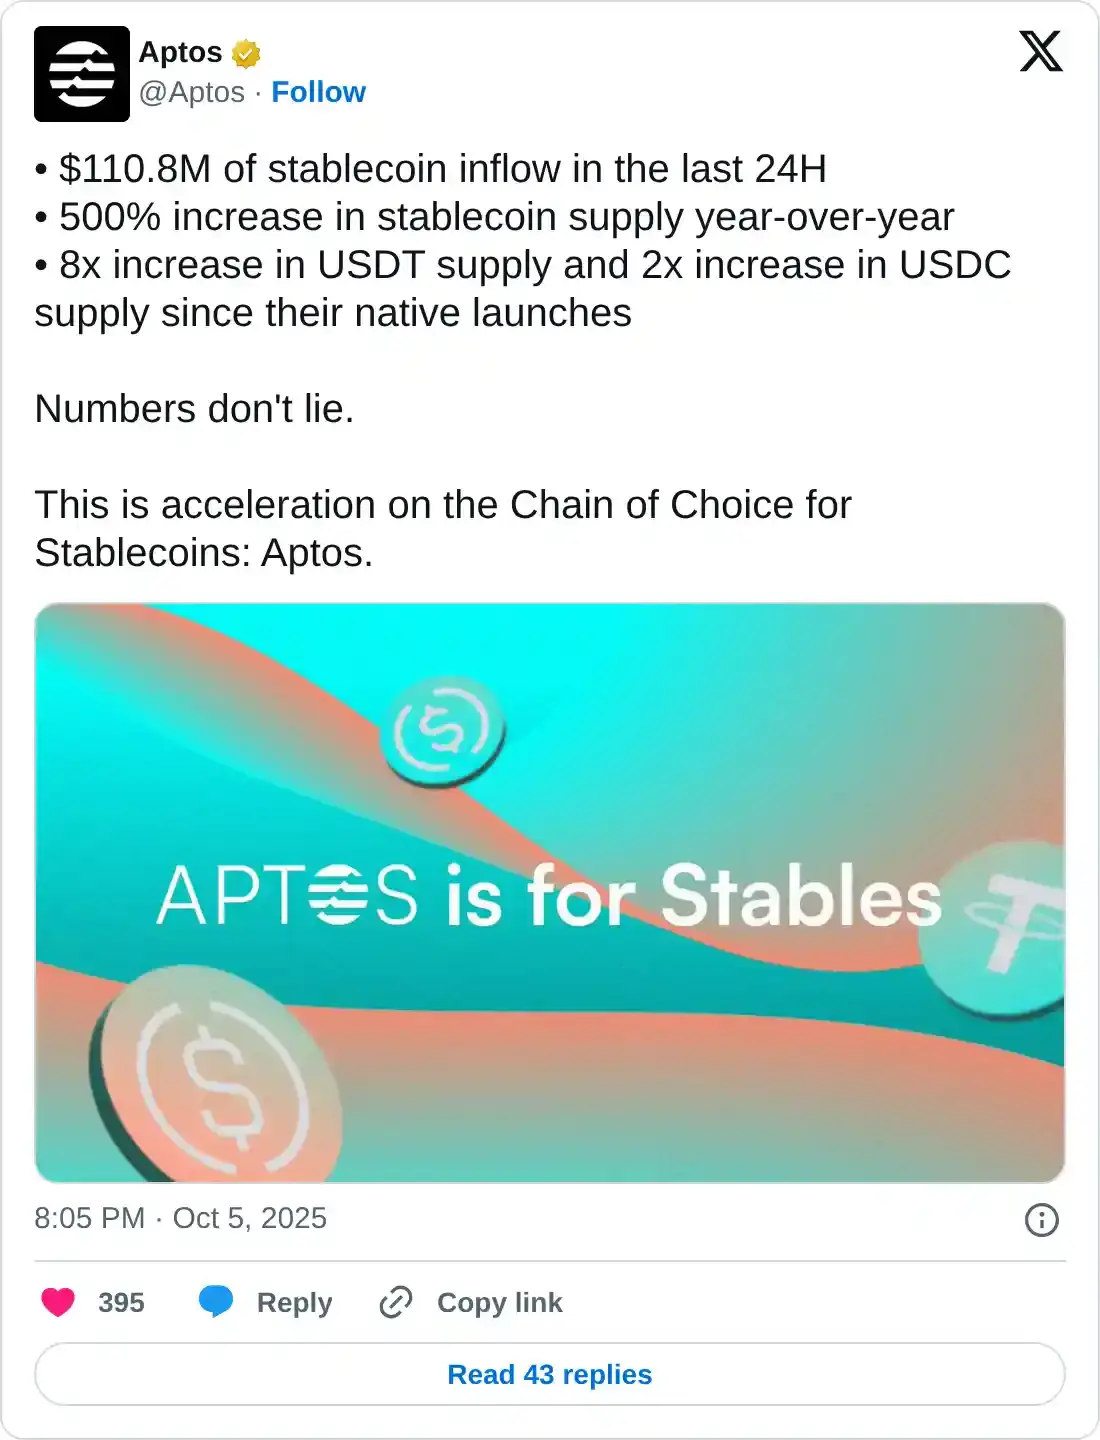
Aptos posted on Monday, sharing the increasing availability of stablecoins on the network. Typically, a rise in stablecoin market capitalization on a network refers to increased liquidity, supporting further Decentralized Finance (DeFi) activities.
Over the last 24 hours, Aptos has seen a stablecoin inflow of over $110 million, representing a 500% year-over-year (YoY) increase, which supports the above thesis. Out of the total increase, the 8x rise in USDT supply and the 2x rise in USDC sustain the duopoly.
Retail demand is on the rise for Aptos
A steady rise in retail interest remains a key driver of the Aptos rally. Derivative traders are acquiring long positions on Aptos, based on CoinGlass data showing futures Open Interest (OI) reaching a record high of $522.23 million, up from $492.57 million on Sunday. This increase in capital inflow in the Aptos futures reflects a risk-on sentiment among traders.
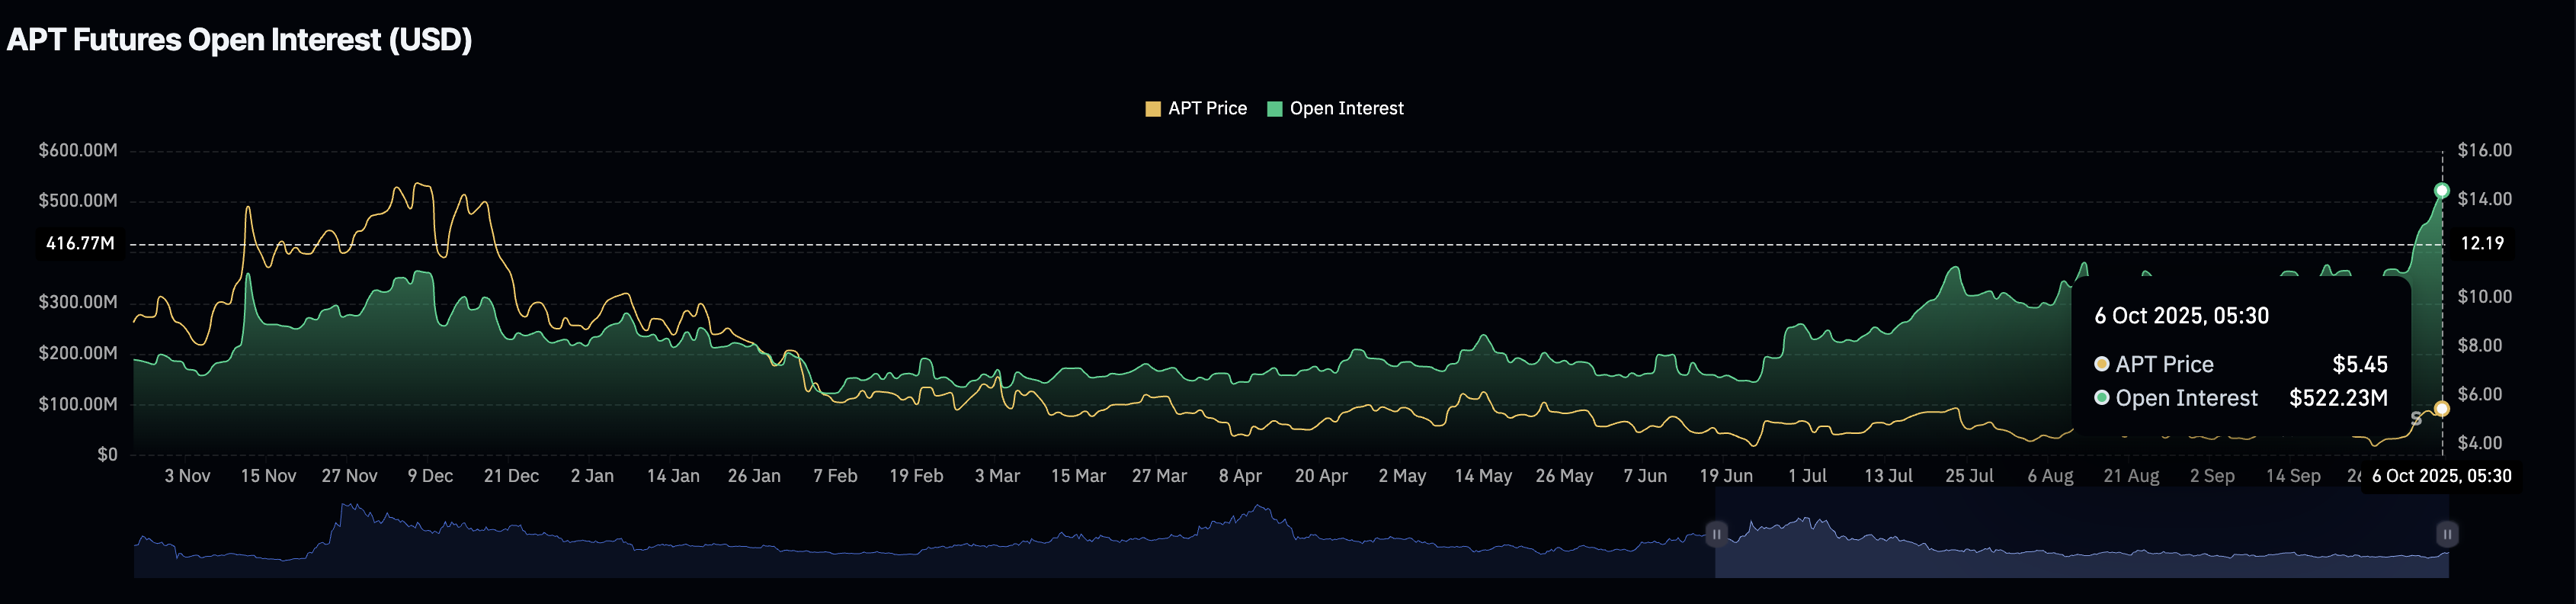
Aptos Open Interest. Source: CoinGlass
Aptos eyes further gains amid an impending bullish cross
Aptos trades above the 200-day Exponential Moving Average (EMA) at $5.166 as the uptrending 50-day and 100-day EMA prepare for a bullish cross. This indicates that the short-term recovery is gaining strength, outpacing the prevailing trend.
Additionally, the momentum indicators on the daily chart maintain a bullish tilt as the Relative Strength Index (RSI) reads 68, close to the overbought zone, signaling heightened buying pressure. Meanwhile, the Moving Average Convergence Divergence (MACD) indicator displays a steady uptrend in the MACD line, indicating a rise in bullish momentum.
If the APT rally holds momentum, it could surpass the overhead R3 resistance pivot level at $5.703, targeting the R4 level at $6.166.
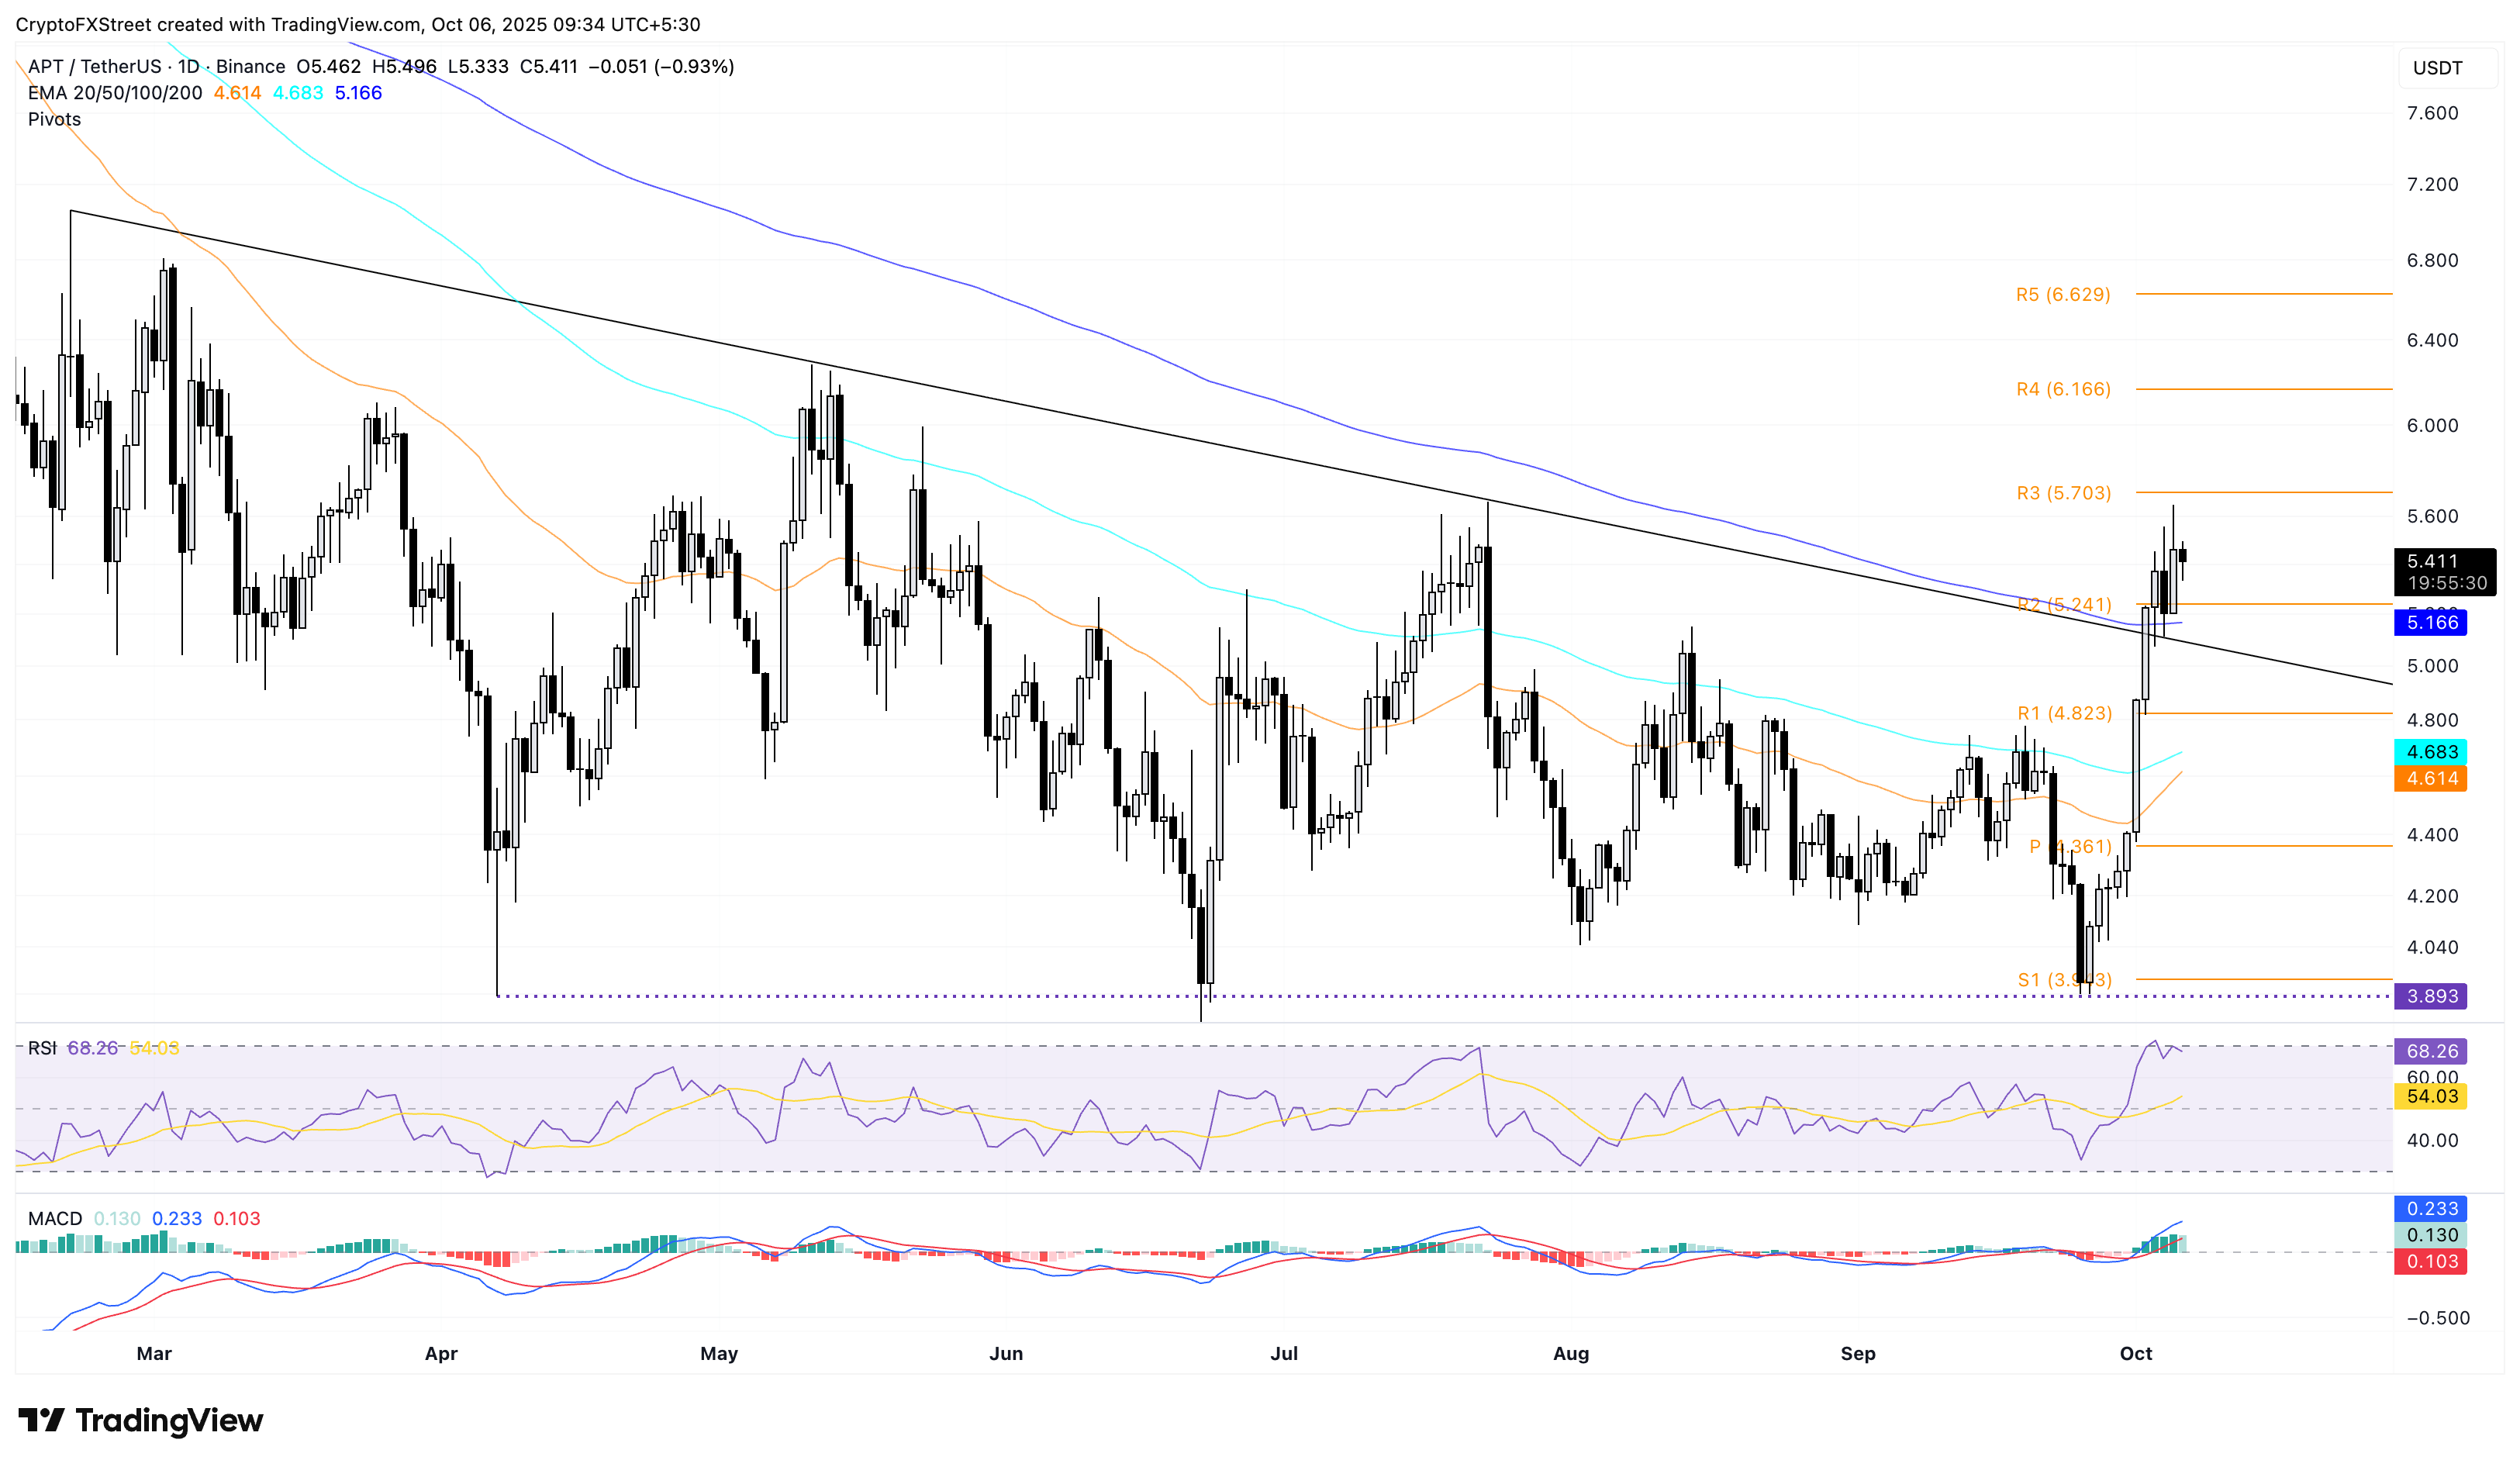
APT/USDT daily price chart.
Looking down, the 200-day EMA at $5.166, moving close to the broken trendline of the descending triangle pattern, remains a crucial support.
Related Articles
$660B Capex Bill Triggers $900B Wipeout: Why Apple Shares Outperform Amazon and Google Despite AI Lag
Based on financial disclosures, the combined 2026 capital expenditure forecasts for Meta, Amazon, Google, and Microsoft are projected to reach $660 billion. This figure is not only significantly higher than the $410 billion forecast for 2025 and $245 billion for 2024, but even surpasses the GDP of I
Amazon Stock Predictions for 2026 to 2030: Will They Exceed Expectations and Achieve Major Long-Term Goals?
TradingKey - As we head into 2026, many investors are questioning where Amazon (AMZN) fits into the technology world.
A Crash After a Surge: Why Silver Lost 40% in a Week?
TradingKey - Spot silver (XAGUSD) prices continue to decline. Silver plunged 20% on Thursday, breaking below $71 per ounce, with the sell-off intensifying on Friday as prices fell further below $64. Compared to the all-time high set on January 29, silver prices have retraced more than 40%, wiping out nearly all gains accumulated over the previous month.
Is Bitcoin’s Four-Year Cycle Dead in 2026?
Is the Bitcoin 4-year cycle dead? After 2025 broke historical records with a red post-halving year, institutional analysts explore if the Bitcoin price has decoupled from the halving countdown. Analyze the impact of spot ETFs, global liquidity, and the roadmap to the 2028 halving in this 2026 market

