

Solana Price Forecast: SOL falls sharply despite record-setting network throughput

- Solana price slips 5% below its key support at $184.13 on Monday, signaling weakness in price action.
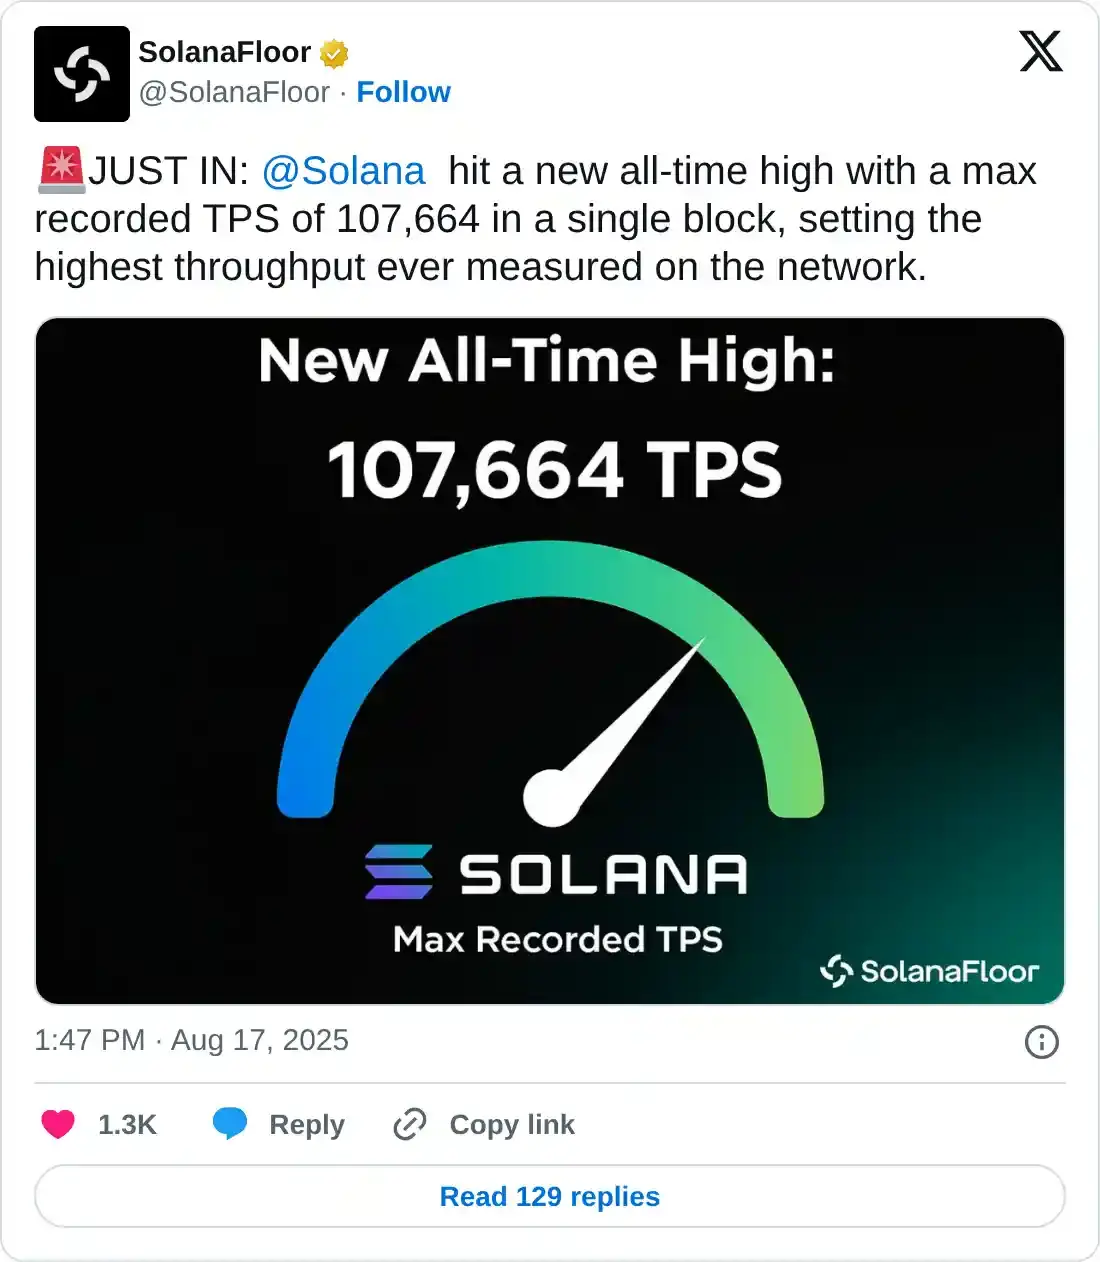
- The SOL network hits a new all-time high throughput, recording 107,664 transactions per second in a single block.
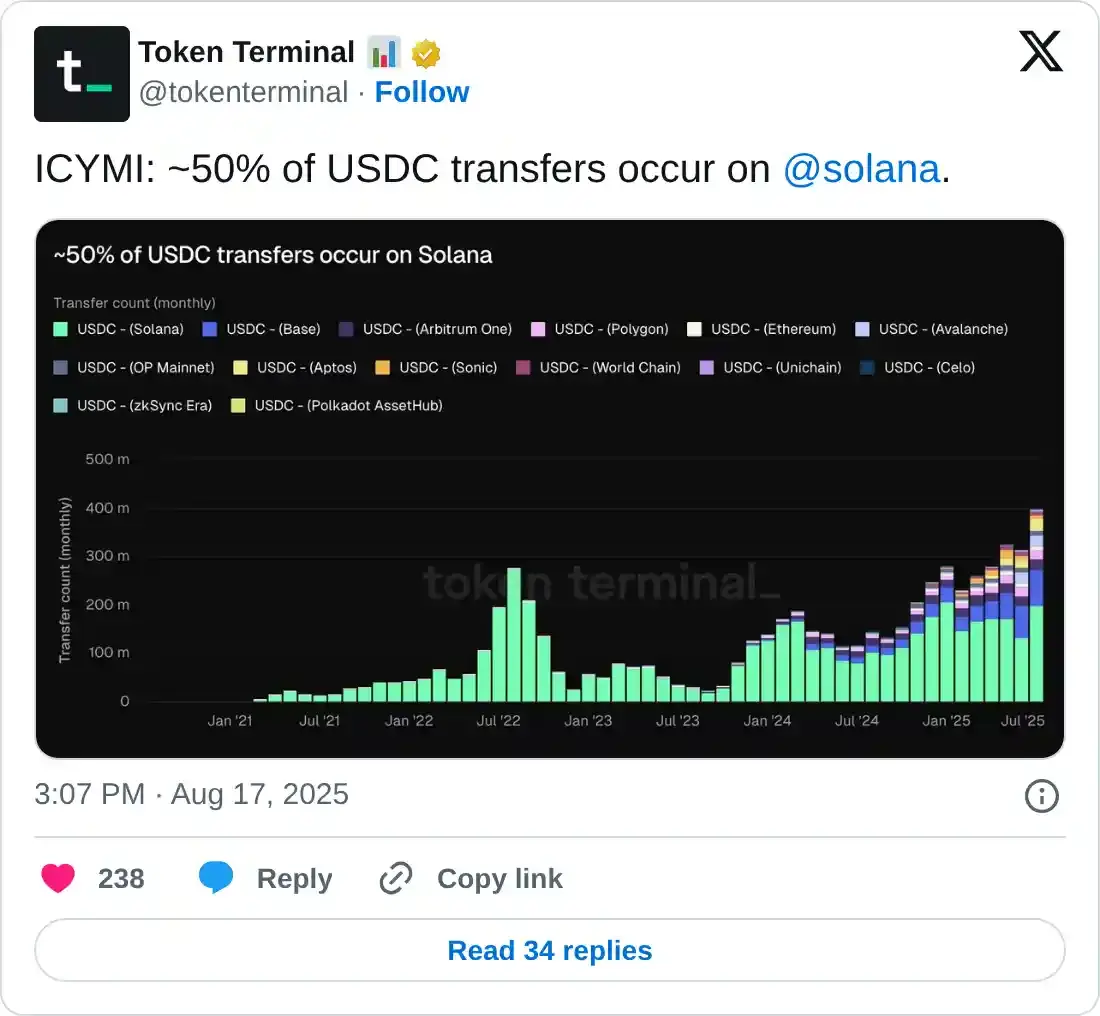
- USDC adoption on Solana remains strong, with Token Terminal data showing 50% of stablecoin transfers occurring on the network.
Solana (SOL) price trades in red, below its key support at $183.13 at the time of writing on Monday, signaling a potential correction ahead. Despite weakness in price action, the Solana network continues to solidify its position by setting 107,664 transactions per second (TPS) in a single block — the highest throughput ever measured on the network. At the same time, USDC stablecoin adoption on Solana is surging, with 50% now occurring on the blockchain.
Solana’s TPS hits record highs
Solana Floor data shows that SOL hit a new all-time high with a max recorded TPS of 107,664 in a single block on Sunday, setting the highest throughput ever measured on the network. This increase in TPS signals Solana’s growing strength and scalability of the network. It also indicates adoption growth and increased utility, which support the long-term bullish outlook for its native token.
Apart from record TPS, Token terminal data shows that 50% of USDC transfers occur on the Solana network, indicating a boost in network usage and attracting more users to the ecosystem.
Solana Price Forecast: SOL slipping below key support
Solana price faced rejection from its daily level of $205.34 on Thursday and declined 8% until the next day. However, SOL found support around the key level at $184.13 on Saturday and recovered slightly until Sunday. At the start of this week on Monday, it trades down by 5% below its key support at $184.13.
If SOL continues its correction, it could extend the decline toward its 50-day Exponential Moving Average (EMA) at $174.16. A successful close below this level could extend additional losses toward its next daily support at $160.
The Relative Strength Index (RSI) on the daily chart is pointing downward toward its neutral level of 50, indicating fading bullish momentum. The Moving Average Convergence Divergence (MACD) lines also converge against each other, indicating indecisiveness among traders. Moreover, the falling green histogram bars also suggest a sign of fading bullish momentum.
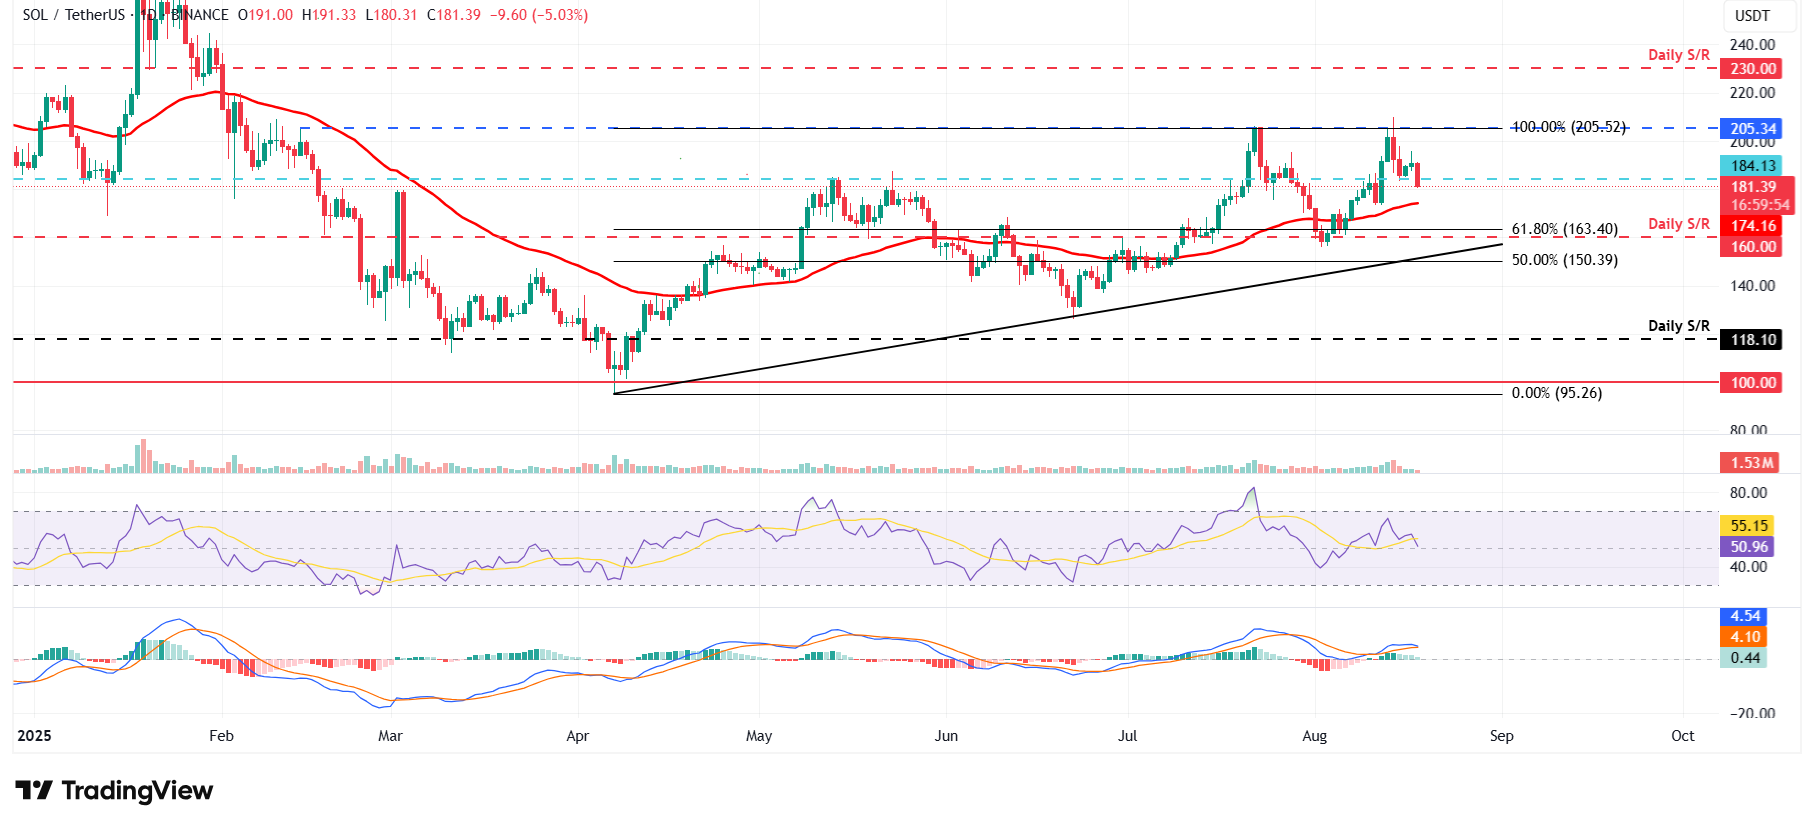
SOL/USDT daily chart
If SOL finds support around the daily level at $184.13 and recovers, it could extend the recovery toward its next daily resistance at $205.34.
Related Articles
$660B Capex Bill Triggers $900B Wipeout: Why Apple Shares Outperform Amazon and Google Despite AI Lag
Based on financial disclosures, the combined 2026 capital expenditure forecasts for Meta, Amazon, Google, and Microsoft are projected to reach $660 billion. This figure is not only significantly higher than the $410 billion forecast for 2025 and $245 billion for 2024, but even surpasses the GDP of I
Amazon Stock Predictions for 2026 to 2030: Will They Exceed Expectations and Achieve Major Long-Term Goals?
TradingKey - As we head into 2026, many investors are questioning where Amazon (AMZN) fits into the technology world.
A Crash After a Surge: Why Silver Lost 40% in a Week?
TradingKey - Spot silver (XAGUSD) prices continue to decline. Silver plunged 20% on Thursday, breaking below $71 per ounce, with the sell-off intensifying on Friday as prices fell further below $64. Compared to the all-time high set on January 29, silver prices have retraced more than 40%, wiping out nearly all gains accumulated over the previous month.
Is Bitcoin’s Four-Year Cycle Dead in 2026?
Is the Bitcoin 4-year cycle dead? After 2025 broke historical records with a red post-halving year, institutional analysts explore if the Bitcoin price has decoupled from the halving countdown. Analyze the impact of spot ETFs, global liquidity, and the roadmap to the 2028 halving in this 2026 market

