

Gold gains traction amid USD weakness and reviving safe-haven demand

- Gold regains positive traction amid a modest USD weakness and reviving safe-haven demand.
- The US-China trade optimism and the Fed’s hawkish tilt might cap gains for the precious metal.
- Traders now look to speeches from influential FOMC members for some meaningful impetus.
Gold (XAU/USD) attracts some buyers during the Asian session on Thursday and now seems to have snapped a four-day losing streak. The US Dollar (USD) struggles to capitalize on the previous day's post-FOMC gains to an over two-week high and drifts lower amid concerns about economic risks stemming from a prolonged US government shutdown. This, in turn, is seen as lending some support to the commodity.
Meanwhile, investors remain on edge following the conclusion of a high-stakes meeting between US President Donald Trump and Chinese leader Xi Jinping. This is evident from a softer tone around the equity markets and turns out to be another factor acting as a tailwind for the safe-haven Gold. That said, the US Federal Reserve's (Fed) hawkish tilt could limit USD losses and cap the non-yielding yellow metal.
Daily Digest Market Movers: Gold attracts safe-haven flows amid renewed USD selling
- The US government shutdown has now entered its fourth week amid a deadlock in Congress on the Republican-backed funding bill, fueling economic concerns. This, in turn, drags the US Dollar away from the post-FOMC swing high and revives demand for the safe-haven Gold during the Asian session on Thursday.
- US President Donald Trump said after his highly anticipated meeting with China’s President Xi Jinping that purchases of soybeans will begin immediately, and all the rare earth issues have been settled. This, along with the Federal Reserve's hawkish tilt, might hold back traders from placing fresh bullish bets around the commodity.
- The US central bank, as was expected, cut interest rates by 25 basis points on Wednesday for the second time this year. The decision drew dissents from two policymakers, with Fed Governor Stephen Miran calling for a deeper cut and Kansas City Fed President Jeffrey Schmid favoring no cut amid inflation worries.
- The US central bank also said it would stop reducing the size of its balance sheet as soon as December, marking the end of its quantitative tightening program. In the post-meeting press conference, Fed Chair Jerome Powell, however, pushed back against expectations about another interest rate cut in December.
- Powell acknowledged the threats that committee members see to the job market, but also the risky nature of making further rate moves without a fuller picture of the economy. This might hold back the USD bears from placing aggressive bets and keep a lid on any meaningful appreciation for the non-yielding yellow metal.
- Traders now look forward to speeches from a slew of influential FOMC members, later during the North American session, for more cues about the future rate-cut path. The outlook, in turn, will play a key role in influencing the near-term USD price dynamics and provide some meaningful impetus to the XAU/USD pair.
Gold might struggle to find acceptance and build on momentum beyond $4,000
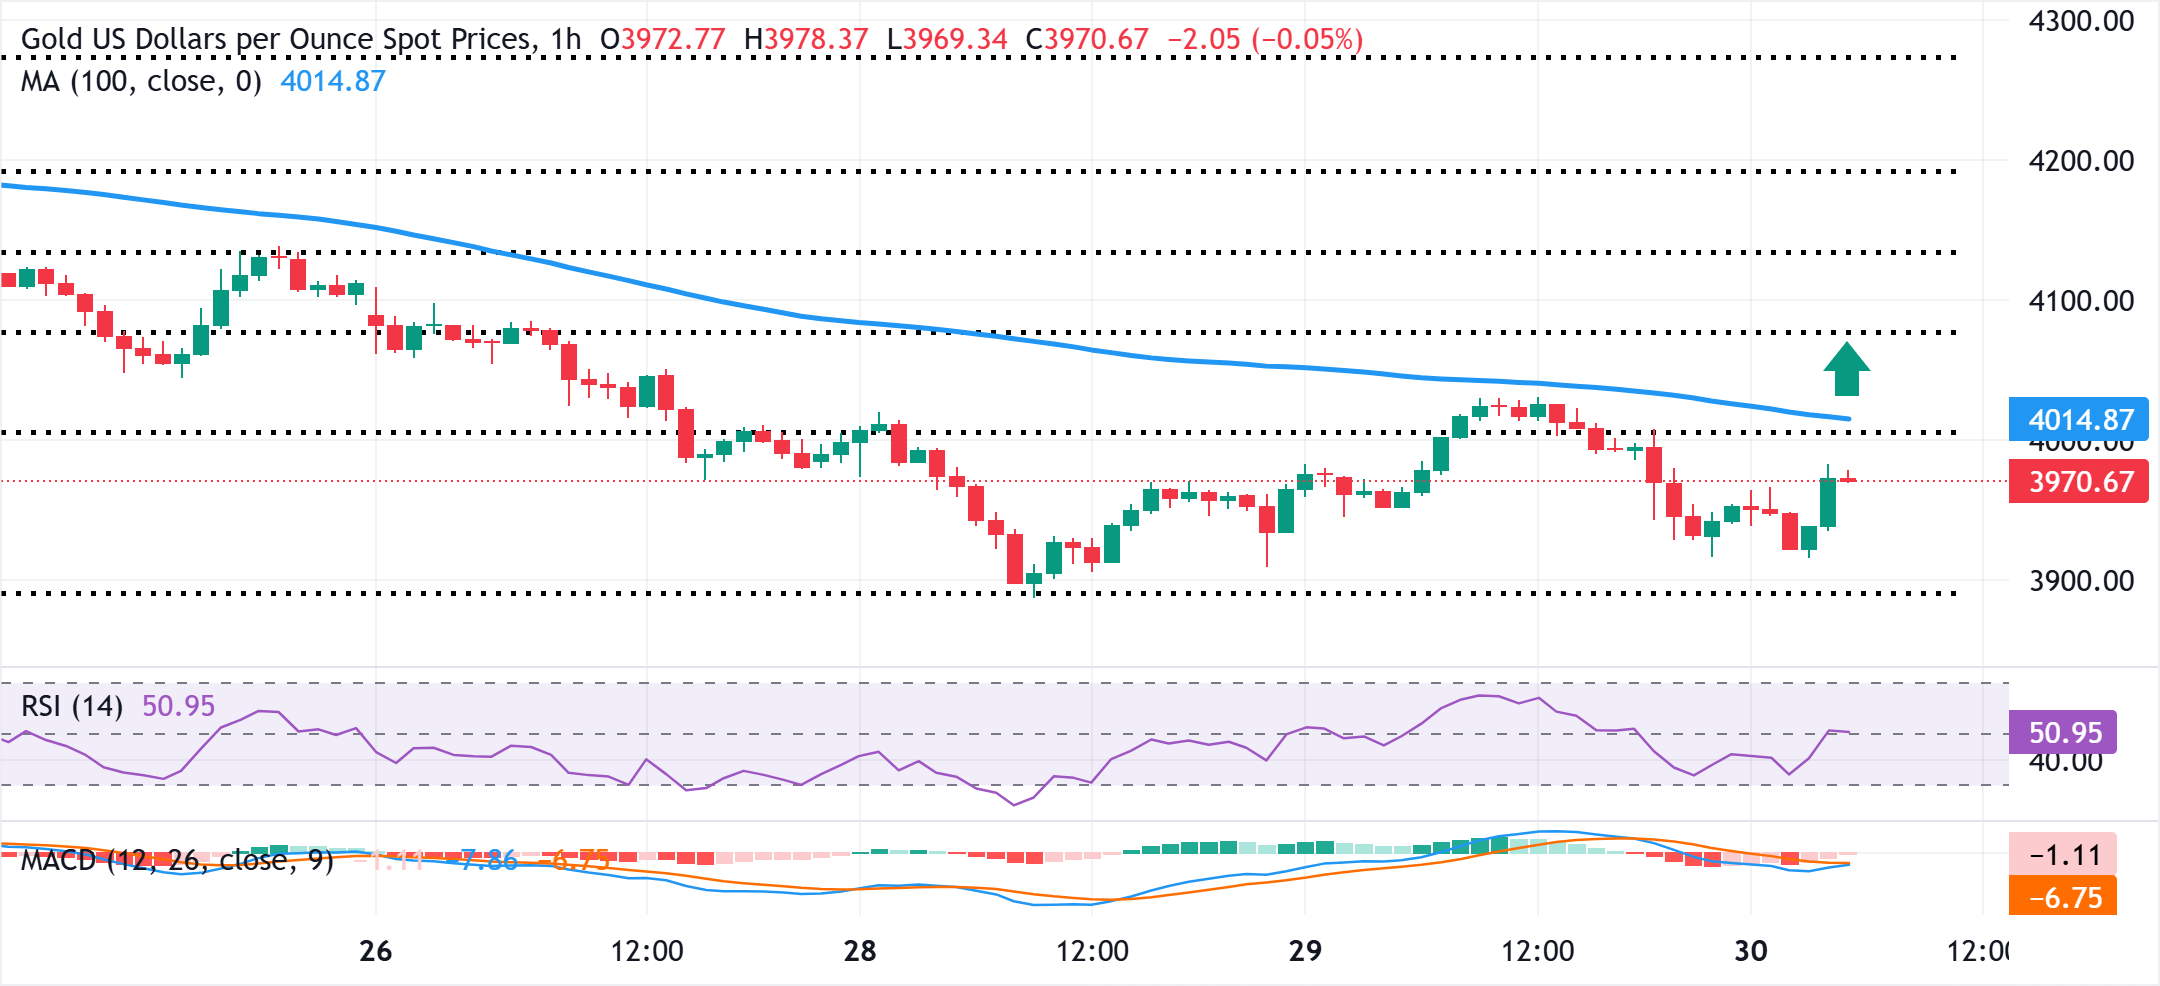
The overnight failure to find acceptance above the 23.6% Fibonacci retracement level of the recent corrective decline from the all-time high and the subsequent slide favor bearish traders. Moreover, oscillators on the daily chart have just started gaining negative traction, suggesting that any further move up might still be seen as a selling opportunity near the $4,000 psychological mark, or the 23.6% Fibo. level. This is closely followed by the 100-hour Simple Moving Average (SMA), around the $4,016 area, above which the Gold price could climb to the $4058-4,060 hurdle en route to the $4,075 region (38.2% Fibo. level) and the $4,100 mark.
On the flip side, weakness back below the $3,950 area might continue to find decent support near the $3,917-3,916 area ahead of the $3,900 round figure and the $3,886 zone, or an over three-week low touched on Tuesday. A convincing break below the latter could make the Gold price vulnerable to accelerate the fall towards the $3,850-3,845 intermediate support before eventually dropping to the $3,800 mark and the next relevant supports near the $3,765-3,760 zone, the $3,700 neighborhood.
US Dollar Price Today
The table below shows the percentage change of US Dollar (USD) against listed major currencies today. US Dollar was the strongest against the Japanese Yen.
| USD | EUR | GBP | JPY | CAD | AUD | NZD | CHF | |
|---|---|---|---|---|---|---|---|---|
| USD | -0.24% | -0.13% | 0.00% | -0.08% | -0.26% | -0.35% | -0.22% | |
| EUR | 0.24% | 0.11% | 0.27% | 0.16% | -0.02% | -0.10% | 0.03% | |
| GBP | 0.13% | -0.11% | 0.14% | 0.05% | -0.12% | -0.22% | -0.08% | |
| JPY | 0.00% | -0.27% | -0.14% | -0.12% | -0.27% | -0.39% | -0.26% | |
| CAD | 0.08% | -0.16% | -0.05% | 0.12% | -0.17% | -0.25% | -0.14% | |
| AUD | 0.26% | 0.02% | 0.12% | 0.27% | 0.17% | -0.09% | 0.04% | |
| NZD | 0.35% | 0.10% | 0.22% | 0.39% | 0.25% | 0.09% | 0.15% | |
| CHF | 0.22% | -0.03% | 0.08% | 0.26% | 0.14% | -0.04% | -0.15% |
The heat map shows percentage changes of major currencies against each other. The base currency is picked from the left column, while the quote currency is picked from the top row. For example, if you pick the US Dollar from the left column and move along the horizontal line to the Japanese Yen, the percentage change displayed in the box will represent USD (base)/JPY (quote).
Recommended Articles


Comments (0)
Click the $ button, enter the symbol, and select to link a stock, ETF, or other ticker.