

Gold pulls back from record highs as USD recovers ahead of Fed decision

- Gold corrects from the record high touched on Tuesday amid a modest USD recovery.
- Dovish Fed expectations should cap the USD and support the non-yielding commodity.
- Rising geopolitical tensions might contribute to limiting losses ahead of the Fed decision.
Gold (XAU/USD) attracts some sellers during the Asian session on Wednesday and moves away from the all-time peak, levels just above the $3,700 mark touched the previous day. The commodity trades with modest losses around the $3,680 and, for now, seems to have snapped a three-day winning streak, though any meaningful corrective decline seems elusive. The US Dollar (USD) stages a modest bounce from its lowest level since early July amid some repositioning trade ahead of the crucial FOMC rate decision, and turns out to be a key factor exerting some pressure on the precious metal.
However, rising bets for a more aggressive policy easing by the US central bank might keep a lid on the attempted USD recovery and continue to offer some support to the non-yielding Gold. Furthermore, rising geopolitical tensions and the cautious market mood might contribute to limiting losses for the safe-haven XAU/USD pair. Traders might also opt to wait for more cues about the Fed's rate-cut path before placing fresh directional bets around the non-yielding yellow metal. This, in turn, makes it prudent to wait for strong follow-through selling before confirming that the commodity has topped out.
Daily Digest Market Movers: Gold witnesses profit-taking as USD rebounds amid some repositioning ahead of the Fed
- The US Dollar recovers slightly from a one-and-a-half-month low as bears opt to lighten their bets ahead of the crucial FOMC policy decision. This, in turn, prompts some profit-taking around the Gold price during the Asian session on Wednesday, especially after the recent blowout rally to a record high.
- The US Census Bureau reported on Tuesday that Retail Sales rose strongly for the third month in a row in August and at a faster-than-anticipated pace, by 0.6%. The data suggested that US consumers remain resilient despite slowing economic activity, lingering inflation, and a weakening job market.
- Investors, however, are all but certain that the US Federal Reserve will slash borrowing costs by at least 25 basis points at the end of a two-day policy meeting later today to support the softening labor market. Moreover, traders have been pricing in the possibility of two more rate cuts by the end of this year.
- Apart from the crucial rate cut announcement, updated economic projections and Fed Chair Jerome Powell's comments at the post-meeting press conference will be scrutinized for cues about the rate-cut path. In the meantime, the dovish outlook might cap the USD and support the non-yielding yellow metal.
- Furthermore, geopolitical risks stemming from the intensifying Russia-Ukraine war may limit losses for the safe-haven commodity. According to a report in The Moscow Times, Ukraine struck one of Russia’s largest oil refining complexes deep within its territory during an overnight attack.
- Furthermore, the Russian defense ministry announced that its troops have taken control of the village of Novomykolaivka in Ukraine's Dnipropetrovsk region. The ministry's claim specifies that the captured village is located near the administrative border with the Donetsk region.
- Meanwhile, Israel launched its long-planned ground assault on Gaza City and its troops have pressed deep into the densely populated city on Tuesday, which has been subjected to intense bombardment for weeks. This might further contribute to limiting deeper losses for the safe-haven XAU/USD.
Gold could attract dip-buying at lower levels; this week’s bullish flag breakout remains in play
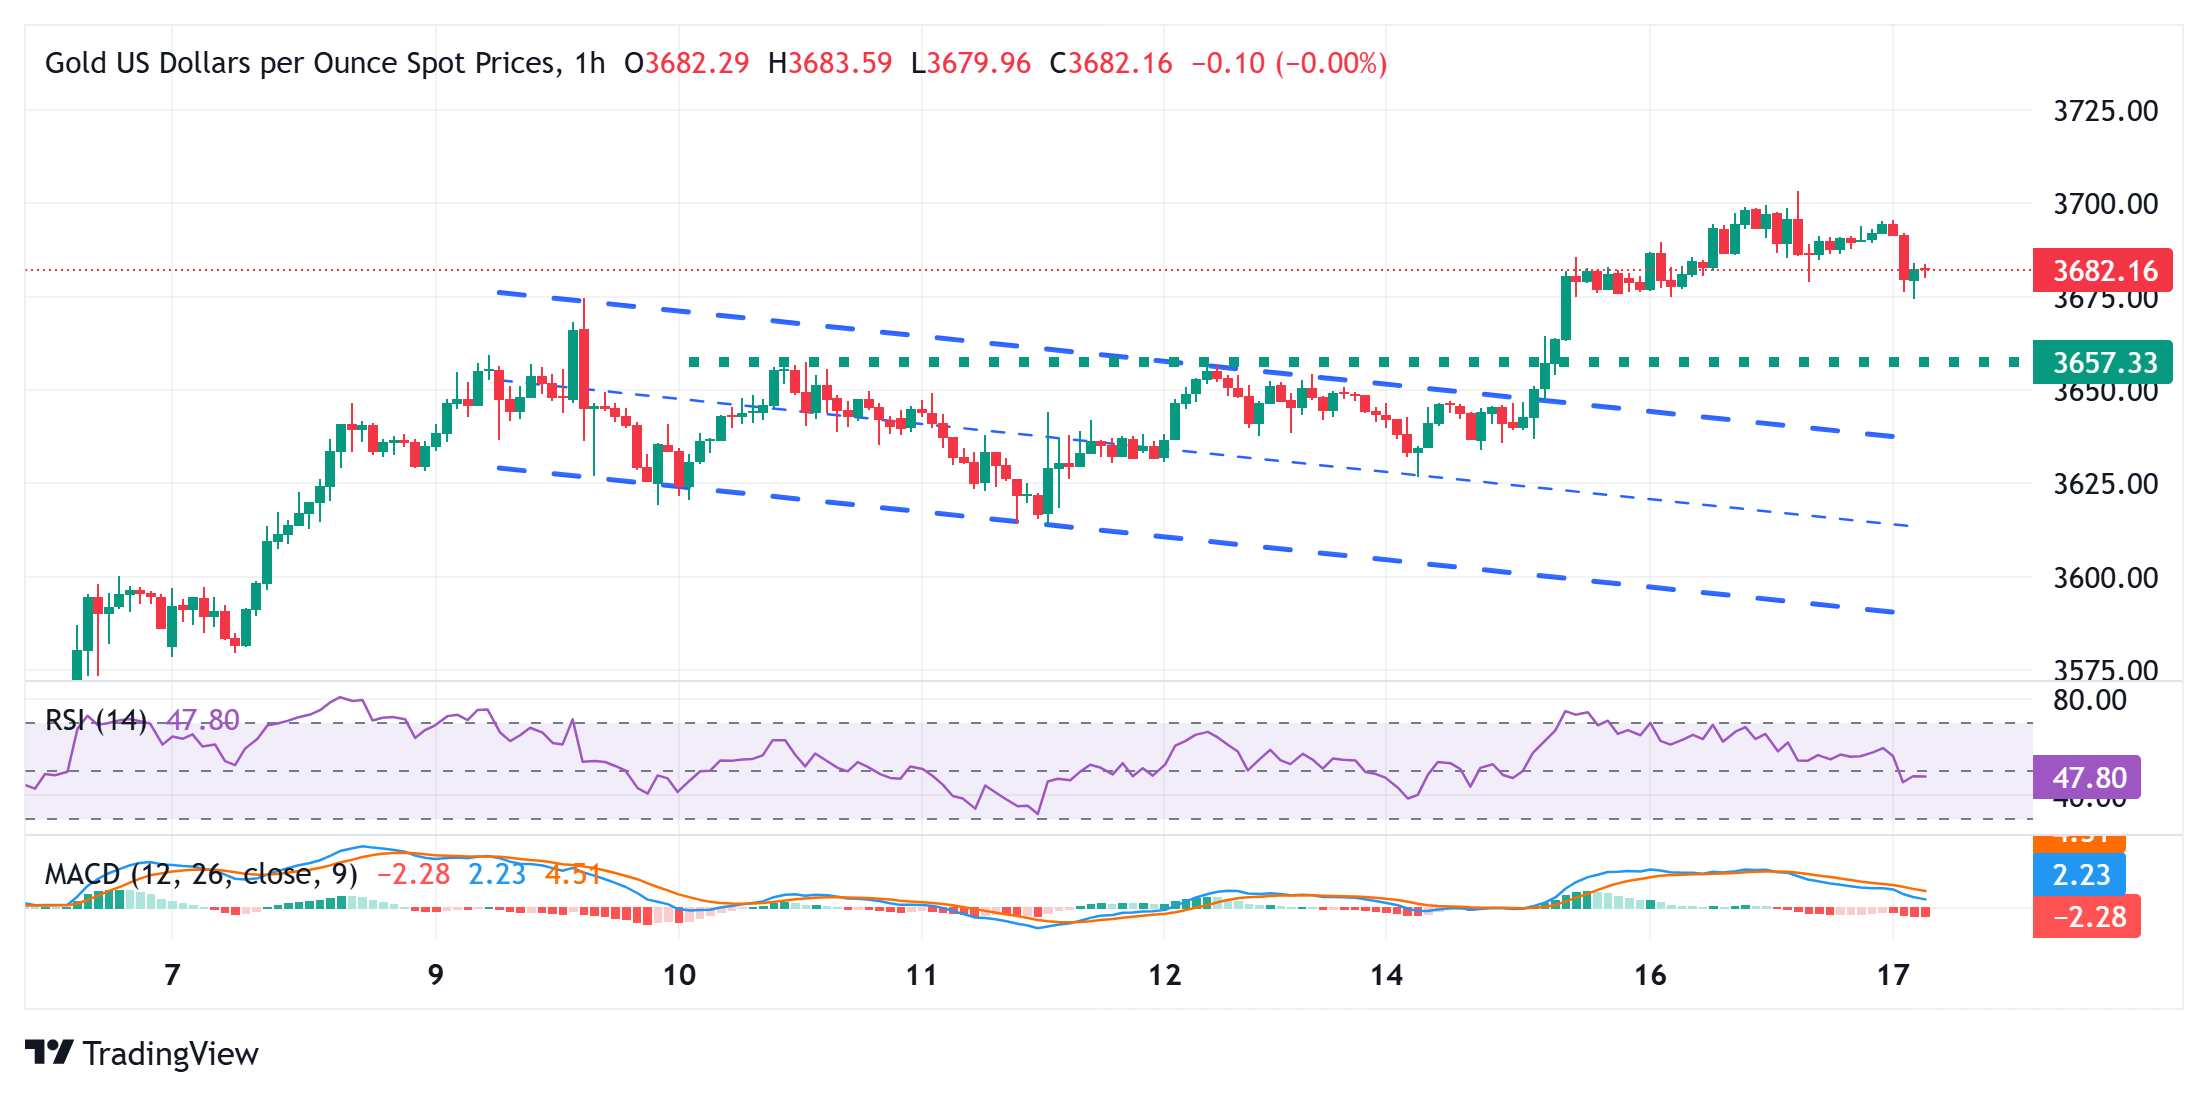
From a technical perspective, the overbought daily Relative Strength Index (RSI) turns out to be a key factor prompting some profit-taking around the commodity. However, this week's breakout through a bullish flag pattern suggests that any further decline could be seen as a buying opportunity near the $3,645 resistance breakpoint. However, some follow-through selling, leading to a subsequent fall below the $3,633 horizontal zone, could drag the Gold price to the $3,610-3,600 area.
The latter should act as a strong base for the XAU/USD pair, which, if broken, could pave the way for deeper losses towards an intermediate support near the $3,562-3,560 region en route to the $3,500 psychological mark. On the flip side, bulls might now wait for sustained strength and acceptance above the $3,700 mark before positioning for an extension of the recent well-established uptrend witnessed over the past month or so.
US Dollar Price Today
The table below shows the percentage change of US Dollar (USD) against listed major currencies today. US Dollar was the strongest against the Swiss Franc.
| USD | EUR | GBP | JPY | CAD | AUD | NZD | CHF | |
|---|---|---|---|---|---|---|---|---|
| USD | 0.10% | 0.04% | 0.03% | 0.09% | -0.00% | 0.00% | 0.16% | |
| EUR | -0.10% | -0.08% | -0.09% | 0.01% | 0.02% | 0.03% | 0.06% | |
| GBP | -0.04% | 0.08% | 0.00% | 0.09% | -0.05% | -0.02% | 0.06% | |
| JPY | -0.03% | 0.09% | 0.00% | 0.06% | 0.08% | -0.00% | 0.00% | |
| CAD | -0.09% | -0.01% | -0.09% | -0.06% | -0.02% | -0.03% | 0.05% | |
| AUD | 0.00% | -0.02% | 0.05% | -0.08% | 0.02% | 0.03% | 0.04% | |
| NZD | -0.01% | -0.03% | 0.02% | 0.00% | 0.03% | -0.03% | 0.05% | |
| CHF | -0.16% | -0.06% | -0.06% | -0.01% | -0.05% | -0.04% | -0.05% |
The heat map shows percentage changes of major currencies against each other. The base currency is picked from the left column, while the quote currency is picked from the top row. For example, if you pick the US Dollar from the left column and move along the horizontal line to the Japanese Yen, the percentage change displayed in the box will represent USD (base)/JPY (quote).
Recommended Articles


Comments (0)
Click the $ button, enter the symbol, and select to link a stock, ETF, or other ticker.