

Gold holds steady amid weaker USD; lacks bullish conviction as traders await Fed decision

- Gold reverses a modest Asian session dip amid a supportive fundamental backdrop.
- Rising Fed rate cut bets keep the USD depressed and continue to benefit the precious metal.
- Geopolitical risks further benefit the safe-haven commodity ahead of key central bank events.
Gold (XAU/USD) attracts some dip-buyers near the $3,627-3,626 region during the Asian session on Monday, though it lacks follow-through and remains confined in a one-week-old range. Rising bets for a more aggressive policy easing by the US Federal Reserve (Fed) keep the USD depressed near its lowest level since July 24 and continue to act as a tailwind for the non-yielding yellow metal. Apart from this, rising geopolitical tensions turn out to be another factor lending support to the safe-haven precious metal.
The XAU/USD bulls, however, seem reluctant to place aggressive bets and opt to move to the sidelines ahead of this week's key central bank event risks. The Bank of Canada (BoC), the Bank of England (BoE), the Fed, and the Bank of Japan (BoJ) are scheduled to announce their decisions this week. The focus, meanwhile, will remain glued to the outcome of a two-day FOMC meeting. Investors will look for cues about the Fed's rate-cut path, which will drive the USD and provide a fresh directional impetus to the Gold price.
Daily Digest Market Movers: Gold bulls retain control as dovish Fed expectations keep USD depressed
- Traders ramped up their bets for three interest rate cuts by the Federal Reserve this year after the recent US macro data pointed to a softening labor market. According to the CME Group’s FedWatch Tool, traders see a 100% chance that the US central bank will lower borrowing costs for the first time in nine months at the end of a two-day meeting on Wednesday.
- Moreover, the Fed is expected to deliver two more rate cuts, in October and in December, which keeps the US Treasury bond yields depressed and the US Dollar close to its lowest level since July 24. This, in turn, assists the non-yielding Gold to attract some dip-buyers at the start of a new week and reverse a modest Asian session dip to the $3,627-3,626 region.
- Ukraine launched a large attack on Russian energy facilities on Sunday amid intensifying drone strikes from both sides. The US has stepped up pressure on NATO countries to tighten energy sanctions on Russia and impose tariffs on countries buying Russian oil in a bid to curtail its revenues and end the deadliest conflict in Europe since World War II.
- Meanwhile, an Iranian lawmaker, Mojtaba Zarei, has called on Qatar to expel US forces and host Iranian Revolutionary Guard hypersonic missiles to counter Israeli threats. This keeps geopolitical risks in play ahead of an Arab-Islamic leaders' summit in Doha and turns out to be another factor that continues to offer some support to the safe-haven precious metal.
- The XAU/USD bulls, however, seem reluctant to place aggressive bets and might opt to wait for this week's key central bank event risks. The Bank of Canada and the US Fed will announce their rate decisions on Wednesday, followed by the Bank of England policy update on Thursday and the outcome of a two-day Bank of Japan policy meeting on Friday.
- Meanwhile, investors will look for more cues about the Fed's rate-cut path, which will drive the USD demand in the near-term and provide a fresh directional impetus to the commodity. Hence, the focus will be on Fed Chair Jerome Powell's comments at the post-meeting press conference and updated economic projections, which include the so-called dot plot.
Gold extends its consolidative price move in a one-week-old range; bullish bias remains
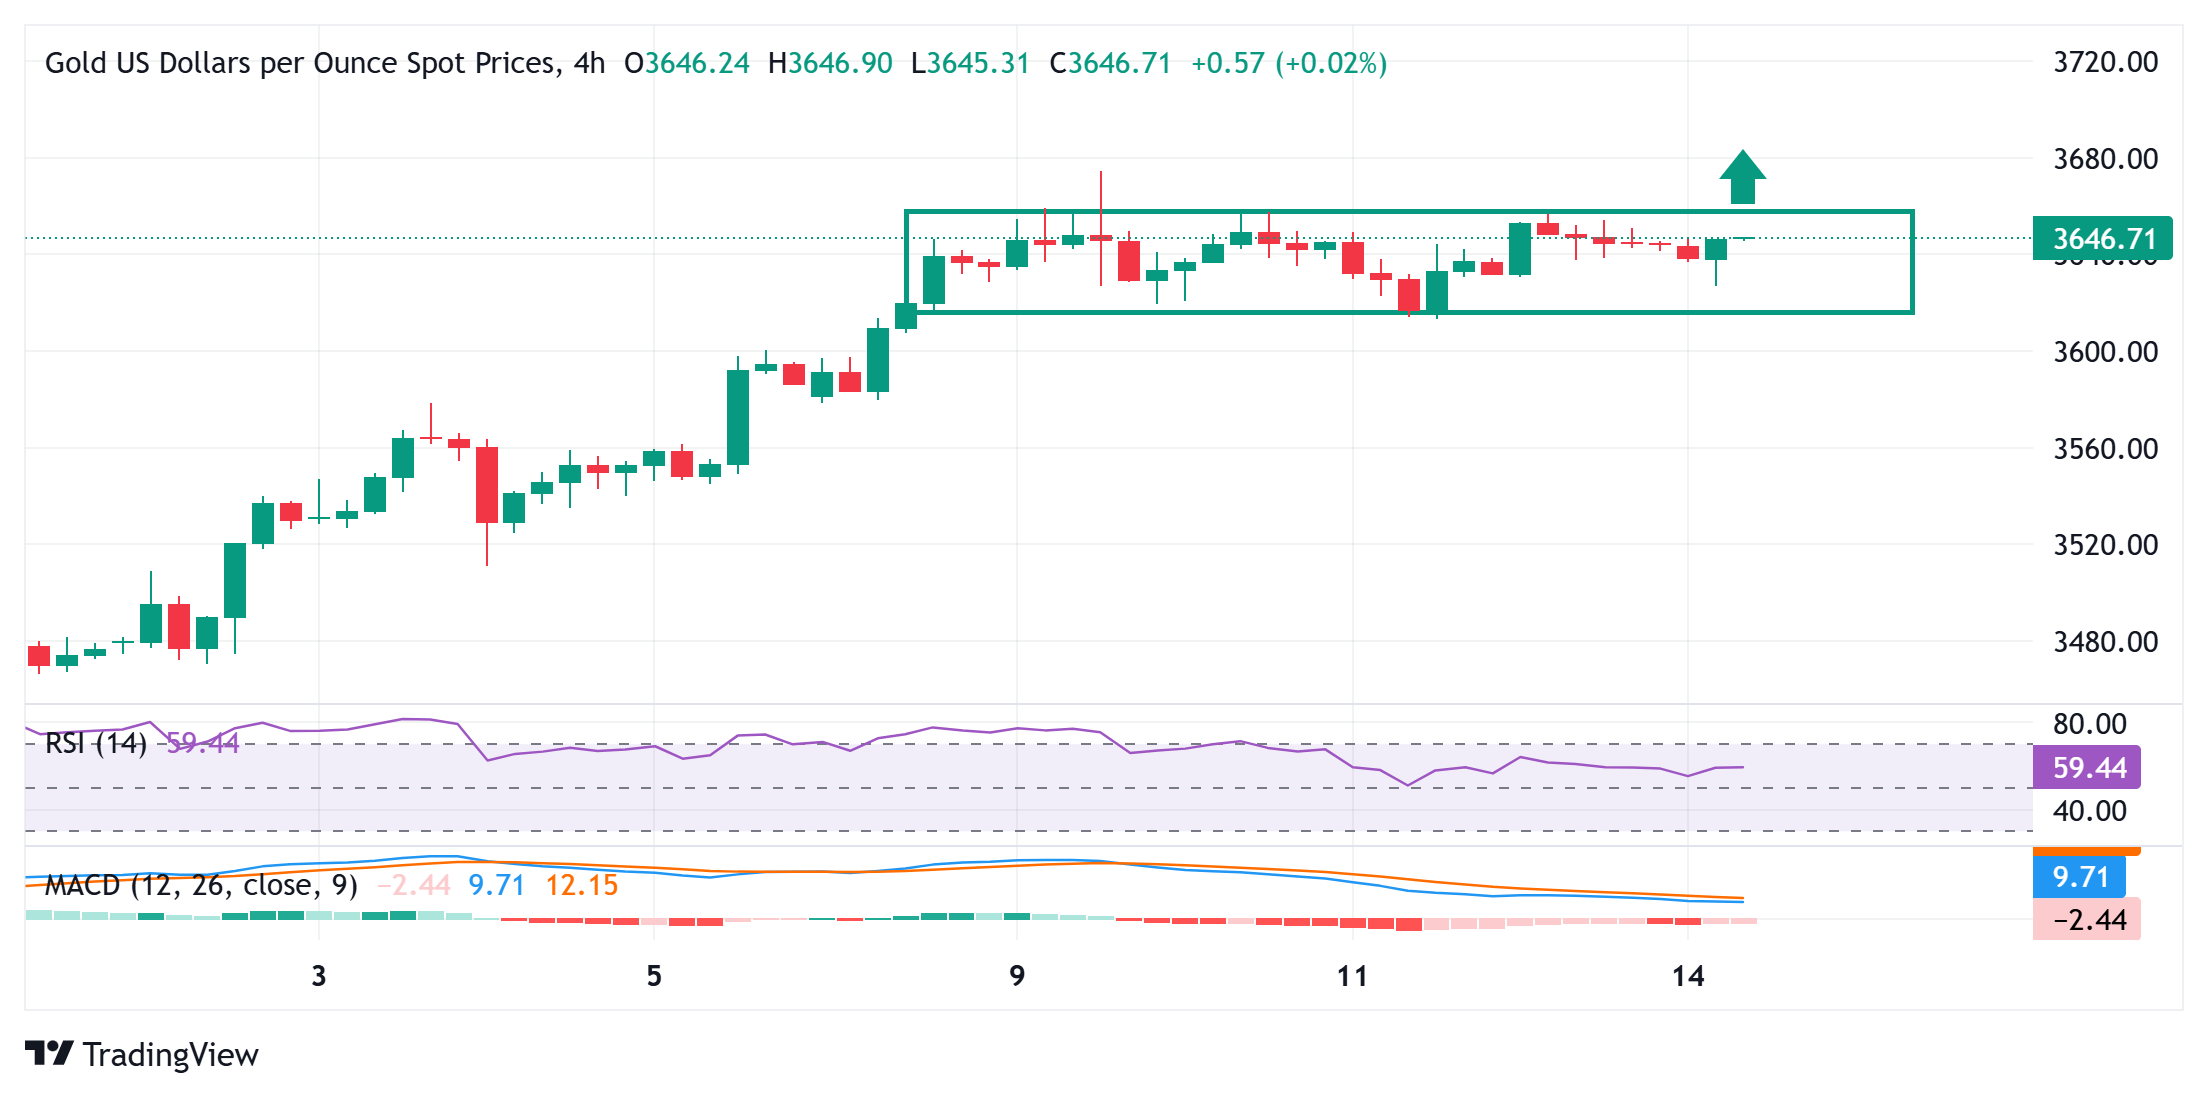
From a technical perspective, the daily Relative Strength Index (RSI) remains in overbought territory and backs the case for an extension of the range-bound price action before the next leg up. That said, momentum beyond the $3,657-3,658 immediate hurdle should allow the Gold price to retest the all-time peak, around the $3,675 zone touched last Tuesday and climb further towards conquering the $3,700 round-figure mark.
On the flip side, the Asian session low, around the $3,627-3,626 zone, could offer immediate support ahead of the $3,610-3,600 region. Some follow-through selling below last week's swing low, around the $3,580 region, could make the Gold price vulnerable to extend the corrective slide towards the $3,565-3,560 intermediate support en route to the $3,500 psychological mark.
US Dollar Price This Month
The table below shows the percentage change of US Dollar (USD) against listed major currencies this month. US Dollar was the strongest against the Canadian Dollar.
| USD | EUR | GBP | JPY | CAD | AUD | NZD | CHF | |
|---|---|---|---|---|---|---|---|---|
| USD | -0.27% | -0.50% | 0.35% | 0.74% | -1.71% | -1.15% | -0.37% | |
| EUR | 0.27% | -0.24% | 0.54% | 1.02% | -1.45% | -0.89% | -0.10% | |
| GBP | 0.50% | 0.24% | 0.68% | 1.26% | -1.21% | -0.64% | 0.19% | |
| JPY | -0.35% | -0.54% | -0.68% | 0.46% | -2.04% | -1.46% | -0.69% | |
| CAD | -0.74% | -1.02% | -1.26% | -0.46% | -2.43% | -1.90% | -1.06% | |
| AUD | 1.71% | 1.45% | 1.21% | 2.04% | 2.43% | 0.57% | 1.41% | |
| NZD | 1.15% | 0.89% | 0.64% | 1.46% | 1.90% | -0.57% | 0.84% | |
| CHF | 0.37% | 0.10% | -0.19% | 0.69% | 1.06% | -1.41% | -0.84% |
The heat map shows percentage changes of major currencies against each other. The base currency is picked from the left column, while the quote currency is picked from the top row. For example, if you pick the US Dollar from the left column and move along the horizontal line to the Japanese Yen, the percentage change displayed in the box will represent USD (base)/JPY (quote).
Related Articles
Amazon Stock Predictions for 2026 to 2030: Will They Exceed Expectations and Achieve Major Long-Term Goals?
TradingKey - As we head into 2026, many investors are questioning where Amazon (AMZN) fits into the technology world.
A Crash After a Surge: Why Silver Lost 40% in a Week?
TradingKey - Spot silver (XAGUSD) prices continue to decline. Silver plunged 20% on Thursday, breaking below $71 per ounce, with the sell-off intensifying on Friday as prices fell further below $64. Compared to the all-time high set on January 29, silver prices have retraced more than 40%, wiping out nearly all gains accumulated over the previous month.
Is Bitcoin’s Four-Year Cycle Dead in 2026?
Is the Bitcoin 4-year cycle dead? After 2025 broke historical records with a red post-halving year, institutional analysts explore if the Bitcoin price has decoupled from the halving countdown. Analyze the impact of spot ETFs, global liquidity, and the roadmap to the 2028 halving in this 2026 market
USD Dollar Trend Forecast: Dollar Index Falls Below 97.0 to 4-Year Low, Will the Dollar Continue To Fall or Bottom Out in 2026?
TradingKey - In January 2026, the US Dollar Index continued its downward trend from 2025, officially breaking below the key 97.0 level and reaching a low of 95.5, marking a nearly four-year low since February 2022.

