

Gold prices bounce on lower US yields, Fed rate cut hopes
- Gold price climbs above $2,400, ending a four-day losing streak amid falling US Treasury yields.
- Traders await crucial economic data, including June’s inflation and Q2 GDP, to gauge the Fed’s next move.
- India’s import tax cut on gold and silver boosts retail demand, supporting bullion prices.
Gold price recovered in the mid-North American session, boosted by a drop in US Treasury bond yields. This pushed the Greenback lower amid a busy Us economic docket in the week, which will feature crucial data. The XAU/USD trades at $2,404, up by 0.33%.
Wall Street trades with gains for the second straight day as market players digest last weekend's political developments in the US. Market players are eyeing the release of June’s inflation data and the preliminary reading of the Gross Domestic Product (GDP) for the second quarter of 2024.
The non-yielding metals are ending a four-day streak of losses as market participants await the Fed's first interest rate cut, according to a Reuters poll. The survey showed that 73 of 100 economists expect Powell and Co. to ease policy by 50 basis points (bps) in 2024, with 13 expecting 25 bps and three expecting no cuts.
Traders speculate the first 25 bps rate cut will be in September, as shown by the CME FedWatch Tool, with odds at 96%.
In the meantime, the US 10-year Treasury bond yield falls one and a half bps to 4.24%, a tailwind for the precious metal.
The Core Personal Consumption Expenditures (PCE) Price Index could be the last piece of the puzzle for Fed officials to begin relaxing policy. Sources cited by Reuters commented, “Anything weaker than expected (PCE data) would be a positive, mainly because it would convince the markets that the U.S. central bank is easing monetary policy in September.”
Bullion was also boosted by India’s slashing import taxes on Gold and Silver, which could lift retail demand.
The US Dollar Index (DXY), which tracks the currency's performance against six other currencies, aims up 0.17% at 104.45. This kept Gold prices glued to the $2,400 mark despite posting gains.
Daily digest market movers: Gold price recovers the $2,400 figure
- Gold traders are focused on the release of key economic data, including Durable Goods Orders, the preliminary Q2 GDP number, and the Core PCE for June.
- Durable Goods Orders are expected to increase from 0.1% to 0.4% month-over-month (MoM).
- The Gross Domestic Product (GDP) for Q2 is projected to rise from 1.4% in Q1 2024 to 1.9% quarter-over-quarter (QoQ), indicating that the economy is accelerating as the year progresses.
- The Fed’s preferred measure of inflation, the Core PCE, is expected to dip from 2.6% to 2.5% year-over-year (YoY).
- The latest Consumer Price Index (CPI) data revealed a continuation of the disinflation process in the United States (US), boosting gold prices and increasing the likelihood that the Fed will cut interest rates starting in September.
- December 2024 fed funds rate futures contract implies that the Fed will ease policy by 50 basis points (bps) toward the end of the year, up from 48 a day ago.
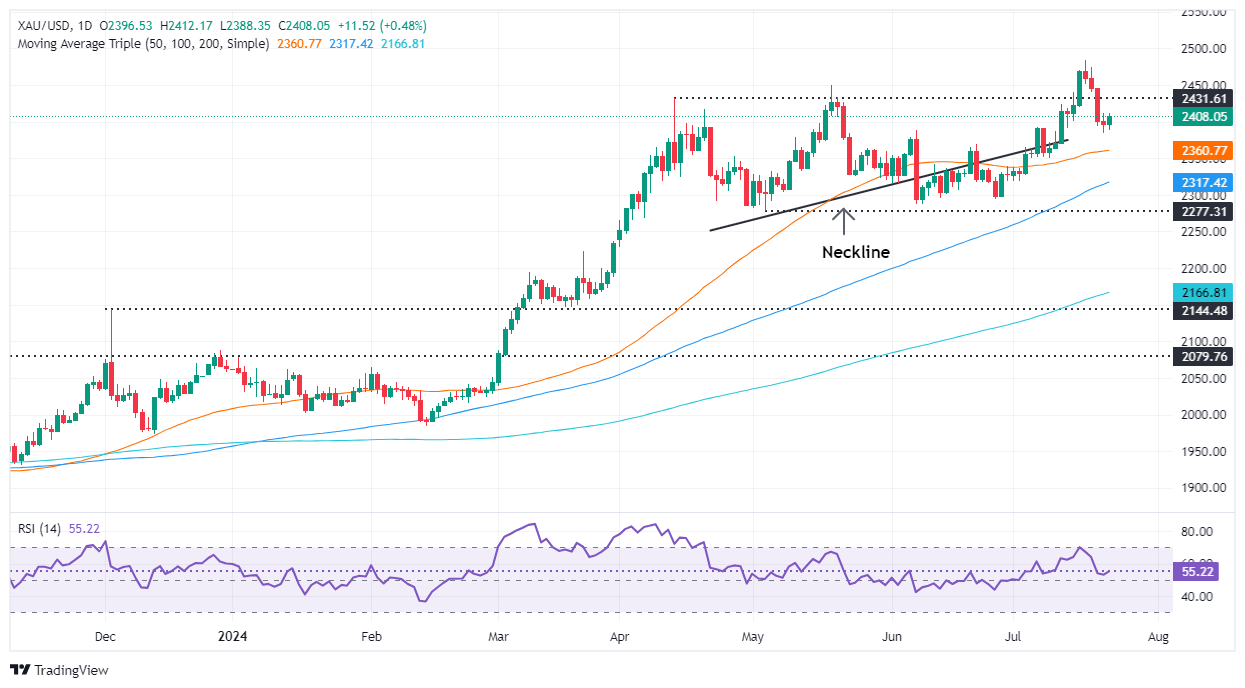
Technical analysis: Gold price contained within Monday’s trading range
Gold price seems to have finished its losing streak, forming a ‘bullish harami,’ a two-candle pattern, hinting the uptrend could continue in the near term.
The Relative Strength Index (RSI) is bullish and indicates that buyers are gathering momentum, which could drive prices higher.
XAU/USD needs to clear Monday’s high at $2,412 for a bullish continuation. Once surpassed, the next resistance would be $2,450 before challenging the all-time high of $2,483. Up next would be the $2,500 figure.
Conversely, if XAU/USD tumbles below the July 22 low of $2,384, a deeper correction is on the cards. The next support would be the 50-day Simple Moving Average (SMA) at $2,359. Once sellers clear the 100-day SMA at $2,315, further losses are seen before falling toward $2,300.
Economic Indicator
Goods Trade Balance
The Goods Trade Balance released by the US Bureau of Economic Analysis and the U.S. Census Bureau is the difference in value between imported and exported goods during a certain month. The figure will be released monthly basis, between 4-7 days before the International Trade Balance, presenting advanced statistics for the reference month. Given that the it started in July 2015, volatility could be erratic during the first releases, although should be understood that higher exports and less imports are dollar positive, whilst the other way around, should produce a negative effect on the USD.
Read more.Next release: Wed Jul 24, 2024 12:30 (Prel)
Frequency: Monthly
Consensus: $-98B
Previous: $-100.2B
Source: US Bureau of Economic Analysis
Related Articles
$660B Capex Bill Triggers $900B Wipeout: Why Apple Shares Outperform Amazon and Google Despite AI Lag
Based on financial disclosures, the combined 2026 capital expenditure forecasts for Meta, Amazon, Google, and Microsoft are projected to reach $660 billion. This figure is not only significantly higher than the $410 billion forecast for 2025 and $245 billion for 2024, but even surpasses the GDP of I
Amazon Stock Predictions for 2026 to 2030: Will They Exceed Expectations and Achieve Major Long-Term Goals?
TradingKey - As we head into 2026, many investors are questioning where Amazon (AMZN) fits into the technology world.
A Crash After a Surge: Why Silver Lost 40% in a Week?
TradingKey - Spot silver (XAGUSD) prices continue to decline. Silver plunged 20% on Thursday, breaking below $71 per ounce, with the sell-off intensifying on Friday as prices fell further below $64. Compared to the all-time high set on January 29, silver prices have retraced more than 40%, wiping out nearly all gains accumulated over the previous month.
Is Bitcoin’s Four-Year Cycle Dead in 2026?
Is the Bitcoin 4-year cycle dead? After 2025 broke historical records with a red post-halving year, institutional analysts explore if the Bitcoin price has decoupled from the halving countdown. Analyze the impact of spot ETFs, global liquidity, and the roadmap to the 2028 halving in this 2026 market

