



tradingkey.logo
tradingkey.logo
Search

FT Vest U.S. Equity Enhance & Moderate Buffer ETF - August

XAUG
Add to Watchlist
39.790USD
0.0000.00%
Market hours 10/22, 12:20(ET)
0.00Volume
0.00Turnover

FT Vest U.S. Equity Enhance & Moderate Buffer ETF - August

39.790
0.0000.00%

Today

0.00%

5 Days

-0.06%

1 Month

+0.01%

6 Months

+3.69%

Year to Date

+6.29%

1 Year

+7.57%

Key Figures

39.800Open
39.790Prev. Close
39.790High
39.790Low
0.00Volume
0Turnover
0.26Volume Ratio
40.03052wk High
36.42352wk Low
3.92KAvg Volume
--Div Yield
--Est. Annual Div.
Downside HedgeInvestment Segment
NoInverse ETF
YesLeveraged ETF
2xLeverage Factor
39.667NAV
USDNAV Currency
--P/B
--Price to earnings ratio

FT Vest U.S. Equity Enhance & Moderate Buffer ETF - August Profile

Ticker SymbolXAUG
Asset ClassAlternatives
Fund ManagerFT Vest
DomicileUS
Expense Ratio0.85%
Founded at2023-08-18
Tracking Index--
XAUG was created on 2023-08-18 by FT Vest. The fund's investment portfolio concentrates primarily on downside hedge alternatives. XAUG seeks to outperform the SPY ETF at about 2x positive price returns while aiming for specific buffered losses and capped gains over a one-year period. The actively managed fund holds options and collateral.
1m
5m
15m
30m
1h
2h
4h
D
W
M
1m
5m
15m
D
Technical Indicators
Sell
Summary
Neutral
Moving Average
Neutral

FT Vest U.S. Equity Enhance & Moderate Buffer ETF - August News

International Copper Prices Rise for 7 Straight Months; Will Bull Market Continue in 2026?

TradingKey - As the "king of industrial metals," every fluctuation in international copper prices impacts the nerves of global investors. In early 2026, international copper prices continued to rise, extending the upward trend from 2025 and reaching a new high above $14,500, marking seven consecutive months of gains. Meanwhile, London Metal Exchange (LME) copper prices have climbed from $7,800 per tonne in July 2025 to over $9,000 per tonne today.

TradingKeyMon, Feb 23
TradingKey - As the "king of industrial metals," every fluctuation in international copper prices impacts the nerves of global investors. In early 2026, international copper prices continued to rise, extending the upward trend from 2025 and reaching a new high above $14,500, marking seven consecutive months of gains. Meanwhile, London Metal Exchange (LME) copper prices have climbed from $7,800 per tonne in July 2025 to over $9,000 per tonne today.
Week Ahead: What Signals Will Fed Minutes Send? US December Core PCE Due

TradingKey - As the U.S. Q4 earnings season draws to a close, a steady rise in market participation has pushed the U.S. stock market into a "new normal" of $1 trillion in average daily trading volume. This week, investors should focus on the U.S. Core PCE Price Index for December; inflation levels remain elevated relative to the Federal Reserve's target. Additionally, attention will be on the Federal Reserve’s monetary policy meeting minutes, as investors search for further policy signals.
TradingKeyMon, Feb 16
TradingKey - As the U.S. Q4 earnings season draws to a close, a steady rise in market participation has pushed the U.S. stock market into a "new normal" of $1 trillion in average daily trading volume. This week, investors should focus on the U.S. Core PCE Price Index for December; inflation levels remain elevated relative to the Federal Reserve's target. Additionally, attention will be on the Federal Reserve’s monetary policy meeting minutes, as investors search for further policy signals.
USD Dollar Trend Forecast: Dollar Index Falls Below 97.0 to 4-Year Low, Will the Dollar Continue To Fall or Bottom Out in 2026?

TradingKey - In January 2026, the US Dollar Index continued its downward trend from 2025, officially breaking below the key 97.0 level and reaching a low of 95.5, marking a nearly four-year low since February 2022.

TradingKeyFri, Jan 30
TradingKey - In January 2026, the US Dollar Index continued its downward trend from 2025, officially breaking below the key 97.0 level and reaching a low of 95.5, marking a nearly four-year low since February 2022.
Gold Nears $5,600 To Hit New Record High as Fed Dovishness and Middle East Tensions Mount; Is $6,000 Not a Dream?

TradingKey - Global financial markets are being swept by a double storm. On one side, spot gold is staging a "mad bull" rally, briefly surging past $5,500/oz and approaching a record high of $5,600. Yet, the enthusiasm of safe-haven capital remains unabated. As the Federal Reserve’s "Super Week" con

TradingKeyThu, Jan 29
TradingKey - Global financial markets are being swept by a double storm. On one side, spot gold is staging a "mad bull" rally, briefly surging past $5,500/oz and approaching a record high of $5,600. Yet, the enthusiasm of safe-haven capital remains unabated. As the Federal Reserve’s "Super Week" con
Gold Pulls Back from Record Highs: Is It Time to Buy?

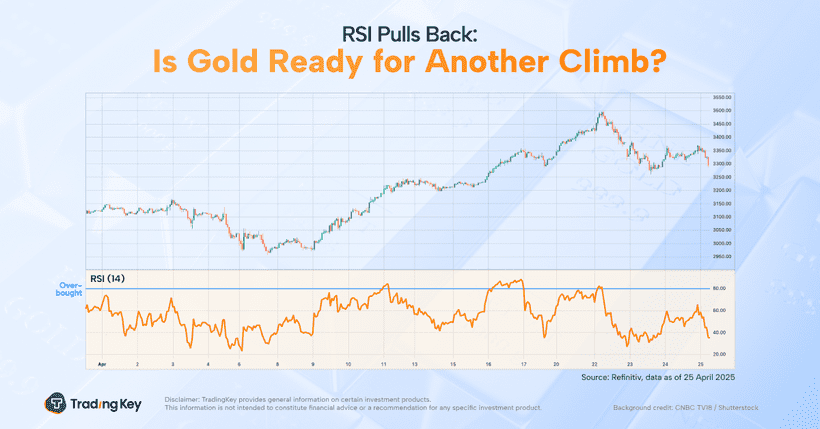
TradingKey - According to Bespoke Research, gold prices have set a new 52-week high 24 times over the past three months, with another record high reached on Tuesday.
TradingKeyApr 28, 2025
TradingKey - According to Bespoke Research, gold prices have set a new 52-week high 24 times over the past three months, with another record high reached on Tuesday.

FAQs

What is the current price of FT Vest U.S. Equity Enhance & Moderate Buffer ETF - August (XAUG)?

The current price of FT Vest U.S. Equity Enhance & Moderate Buffer ETF - August (XAUG) is 39.79. Market data may be delayed; please refer to the timestamp displayed on the page.

What is the 52-week high of FT Vest U.S. Equity Enhance & Moderate Buffer ETF - August?

The 52-week high of FT Vest U.S. Equity Enhance & Moderate Buffer ETF - August is 40.03. Please refer to the page timestamp for the latest data.

What is the 52-week low of FT Vest U.S. Equity Enhance & Moderate Buffer ETF - August?

The 52-week low of FT Vest U.S. Equity Enhance & Moderate Buffer ETF - August is 36.42. Please refer to the page timestamp for the latest data.

What is the NAV of FT Vest U.S. Equity Enhance & Moderate Buffer ETF - August?

The NAV of FT Vest U.S. Equity Enhance & Moderate Buffer ETF - August is 39.67 today. NAV represents the fund’s total assets minus its liabilities and helps indicate its underlying per-share value.

Is FT Vest U.S. Equity Enhance & Moderate Buffer ETF - August (XAUG) a safe investment?

No investment is completely risk-free. The risk level of FT Vest U.S. Equity Enhance & Moderate Buffer ETF - August (XAUG) depends on its underlying assets, strategy, liquidity, fees, and market conditions. Diversification may reduce potential losses but cannot eliminate them, and past performance does not guarantee future results. Before investing, consider whether the fund aligns with your goals and risk tolerance. This is not investment advice.
tradingkey.logo
Risk Warning: Our Website and Mobile App provides only general information on certain investment products. Finsights does not provide, and the provision of such information must not be construed as Finsights providing, financial advice or recommendation for any investment product.
Investment products are subject to significant investment risks, including the possible loss of the principal amount invested and may not be suitable for everyone. Past performance of investment products is not indicative of their future performance.
Finsights may allow third party advertisers or affiliates to place or deliver advertisements on our Website or Mobile App or any part thereof and may be compensated by them based on your interaction with the advertisements.
© Copyright: FINSIGHTS MEDIA PTE. LTD. All Rights Reserved.









