

iShares Core S&P 500 ETF
IVVToday
-1.42%
5 Days
-1.97%
1 Month
-1.60%
6 Months
+6.69%
Year to Date
+7.63%
1 Year
+22.26%
iShares Core S&P 500 ETF News
SPY vs. IVV vs. VOO: Which S&P 500 Index ETF Is More Suitable for You?
TradingKey - The S&P 500 Index rose for nine consecutive trading days on June 2, reaching a new all-time high and marking its longest winning streak in over a year. The performance of the S&P 500 serves as a direct indicator of the overall trend of the U.S. stock market. From the perspective of asset allocation, investing in the S&P 500 is equivalent to allocating capital to a portfolio that is deeply coupled with the overall performance of the U.S. macroeconomy. Therefore, investing in the S&P 500 is essentially a bet on the medium-to-long-term growth potential and earnings capacity of U.S. listed companies.

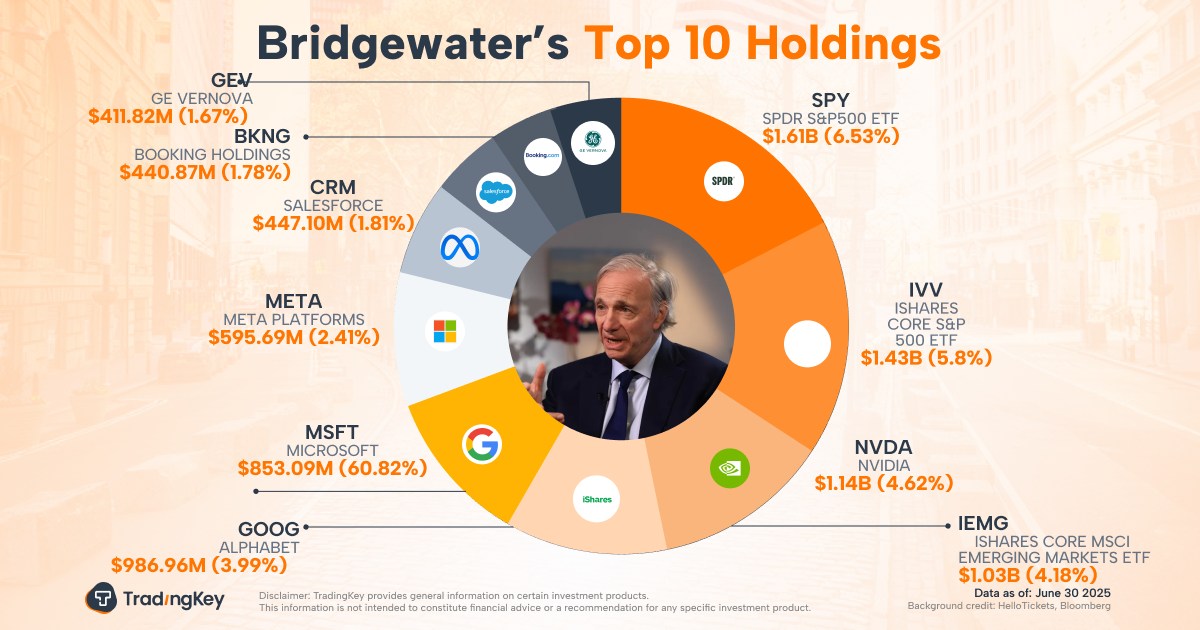
Bridgewater Associates Q2 2025 13F Analysis: Founder Ray Dalio’s Final Act
TradingKey - Bridgewater Associates, the world’s largest hedge fund and renowned for its macroeconomic analysis, continues to command market respect with its “risk parity” strategy and precise economic cycle timing.
Popular Instruments
