

Search
GLD
GLDAdd to Watchlist
373.630USD
0.0000.00%
Close 06/26, 16:00(ET)Quotes delayed by 15 min
0.00Volume
0.00Turnover
View Detailed Chart
TradingKey 图表Intraday
1m
30m
1h
D
W
M
D
Today
0.00%
5 Days
-3.48%
1 Month
-9.75%
6 Months
-10.34%
Year to Date
-5.72%
1 Year
+21.79%
Key Figures
--Open
373.630Prev. Close
0.000High
0.000Low
0.00Volume
0Turnover
0.69Volume Ratio
GLD News
The U.S. Dollar Index Is the Key Driver of Gold Prices: Where Are the Dollar and Gold Headed Next?
TradingKey - The strength or weakness of the U.S. Dollar Index stands as the core determinant shaping gold's trajectory.
TradingKeyFri, Nov 21

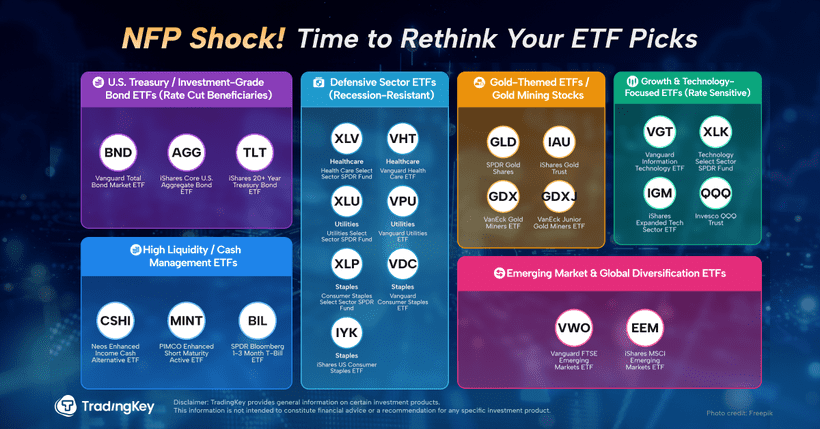
Post-NFP Shocker: What It Means for Your Portfolio
TradingKey - The latest data from the U.S. Bureau of Labor Statistics delivered a wake-up call. Job gains from the prior two months were revised down by 258,000 — a surprisingly large downgrade.
TradingKeyTue, Aug 5
Popular Instruments
