


TradingKey - On November 21, U.S. equity markets will witness a historic moment—as predicted by Goldman Sachs, options contracts with a staggering $3.1 trillion in notional value will expire simultaneously. This includes $1.7 trillion in S&P 500 index options and $725 billion in individual stock options. Such concentrated expirations force traders to adjust their positions, creating substantial market impact.
In options trading, profit and loss calculations differ fundamentally from stock investments. Many traders have experienced this confusion: believing they've secured profits at trade conclusion, only to find actual account returns far below expectations—or even showing losses. This cognitive gap often stems from an incomplete understanding of options expiration profit/loss mechanisms.
Stock trading follows the simple principle of "buy low, sell high," while options P&L calculations involve greater complexity. Traders must consider multiple factors simultaneously—premium costs, strike prices, time value decay, and implied volatility. With $3.1 trillion in options positions entering settlement simultaneously, accurately calculating potential profits and losses becomes a core capability for investors to assess risks and seize opportunities.
This article systematically breaks down the calculation logic for options expiration profit and loss. Through fundamental concepts, practical formulas, and real-world case studies, we provide investors with the tools to correctly calculate options expiration outcomes.

(Source: Freepik)
Fundamentals of Options Trading
Strike Price
The strike price is the predetermined transaction price for the underlying asset specified in the options contract—it serves as the baseline for profit and loss (P&L) calculations. These prices are set at standardized intervals to ensure market uniformity.
For call options, traders typically select strike prices below the current underlying asset price. For put options, strikes are usually set above the current price.
For example, in a call option contract stipulating "the right to buy a stock at $100," $100 is the strike price.
Option Premium
The option premium is the fee paid by the buyer to acquire contractual rights—and the income received by the seller. In U.S. markets, premiums are quoted per share, but each standard options contract represents 100 shares of the underlying asset. Thus, the actual transaction cost equals the premium multiplied by 100.
For instance, a $2-per-share premium translates to a $200 total cost per contract. For buyers, this premium represents the maximum possible loss; for sellers, it defines the ceiling of potential gain.
Expiration Price
The expiration price refers to the underlying asset’s actual market price on the contract’s expiration date. This price serves as the ultimate determinant of options P&L, working alongside the strike price and premium to define final profit or loss.
Break-Even Point
The break-even point is a critical threshold in options trading—the underlying asset price level at expiration that allows investors to recoup their paid premium. This price holds significance for both parties: for buyers, prices beyond this point generate profit; for sellers, prices below it trigger losses.
Option Types and Exercise Rules
In U.S. markets, stock and ETF options typically follow American-style exercise rules, permitting holders to exercise at any trading day before expiration. Index options, however, are predominantly European-style, exercisable only on the expiration date. Though exercise mechanisms differ, the calculation logic for expiration P&L remains consistent. Investors should align contract choices with their trading strategies when selecting options.
Calculating Call Option Profits
Call options grant holders the right, but not the obligation, to purchase the underlying asset at a predetermined price during the contract period. Options trading involves two distinct roles—buyers and sellers—with fundamentally different profit calculation methods. Understanding both parties’ profit/loss mechanics is critical for developing effective trading strategies.
Buyer Profit Calculation
As a call option buyer, traders pay a premium to secure the right to purchase the underlying asset at the strike price in the future. The investment objective is to profit when the underlying asset’s price rises above the strike price.
Call option buyer P&L: [max(0, ST – K) – C] × Contract Size
Where :
ST = Underlying asset price at expiration
K = Strike price
C = Call option premium
P = Put option premium
This strategy’s maximum loss is limited to the premium paid. When the underlying asset price is at or below the strike price at expiration, the option expires worthless, resulting in a total loss equal to the premium.
The maximum profit is theoretically unlimited since the underlying asset’s price can rise indefinitely, making call options an effective tool for capturing significant upward price movements. The break-even point equals the strike price plus the premium—net profits only materialize when the underlying asset’s price exceeds this level.
Practical Example:
Assume purchasing one call option with a $100 strike price at a $6 premium, where each contract represents 100 shares of the underlying asset. If the underlying asset price is $125 at expiration:
Total profit = [(125 - 100) × 100] - (6 × 100) = 2,500 - 600 = $1,900
If the price at expiration is $95, the holder would choose not to exercise, losing the $600 premium ($6 × 100)—the maximum possible loss.
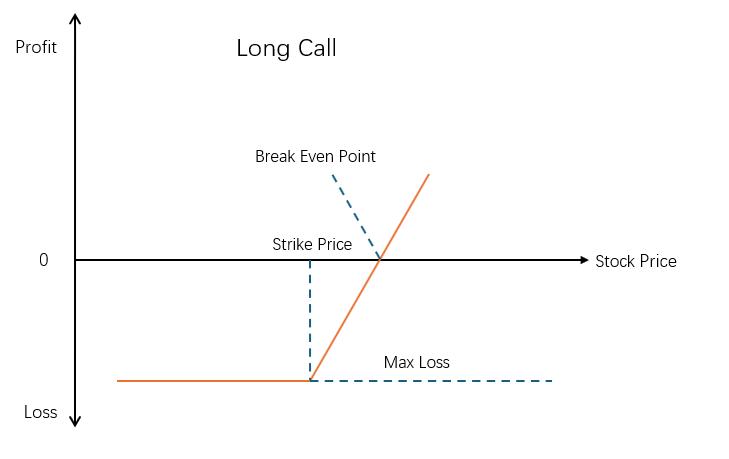
As shown in the chart, the call option buyer’s profit curve exhibits nonlinear characteristics. Below the break-even point, losses remain fixed at the premium amount. Above this threshold, profits increase linearly with the underlying asset’s price appreciation.
Seller Profit Calculation
As a call option seller, traders collect premiums while assuming the obligation to sell the underlying asset at the predetermined strike price. This strategy is based on the expectation that the underlying asset price will not rise significantly—a trading approach with limited profit potential but substantial risk exposure.
Call option seller P&L: [C – max(0, ST – K)] × Contract Size
Where:
ST = Underlying asset price at expiration
K = Strike price
C = Call option premium
P = Put option premium
The strategy’s maximum profit is limited to the collected premium, realized when the underlying asset price remains at or below the strike price.
The maximum loss is theoretically unlimited, as continuous price appreciation in the underlying asset can drive potential losses higher.
The break-even point occurs at the sum of the strike price and premium—serving as the critical threshold for determining trade outcomes.
Practical Example:
When a trader sells one call option with a $110 strike price at a $7 premium (each contract representing 100 shares), and the underlying asset price is $120 at expiration:
Total profit = (7 × 100) - [(120 - 110) × 100] = 700 - 1,000 = -$300
If the expiration price is $105, the trader retains the full $700 premium income—representing the strategy’s maximum possible profit.
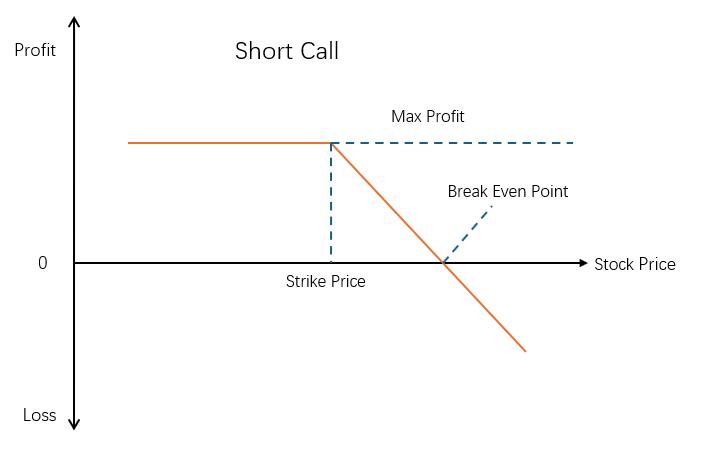
As shown in the chart, profits remain fixed at the total premium amount below the break-even point. When the underlying price exceeds this threshold, losses increase linearly with price appreciation—a structure that clearly demonstrates the risk exposure call sellers face during upward market movements.
Calculating Put Option Profits
A put option grants the buyer the right to sell the underlying asset at a predetermined strike price before a specific future date. The buyer pays a premium to obtain this right but bears no obligation to exercise it. When the underlying asset price falls below the strike price, the put option acquires intrinsic value, which increases as the price declines further.
Buyer Profit/Loss Calculation
A put option is a financial contract granting the buyer the right to sell the underlying asset at a predetermined strike price before a specific future date. Traders pay a premium to secure this right without assuming any obligation to exercise it. When the underlying asset price falls below the strike price, the put option develops intrinsic value that increases as the asset price continues to decline.
Put option buyer P&L: [max(0, K – ST) – P] × Contract Size
Where:
ST = Underlying asset price at expiration
K = Strike price
C = Call option premium
P = Put option premium
Practical Example
When the strike price is $50, the premium is $2, and the underlying asset's final price is $40 (each contract represents 100 shares):
Total profit = (50 - 40)×100 - (2×100) = $800
Conversely, if the underlying asset price ends at $55, the put option expires worthless, and the investor loses the $200 premium.
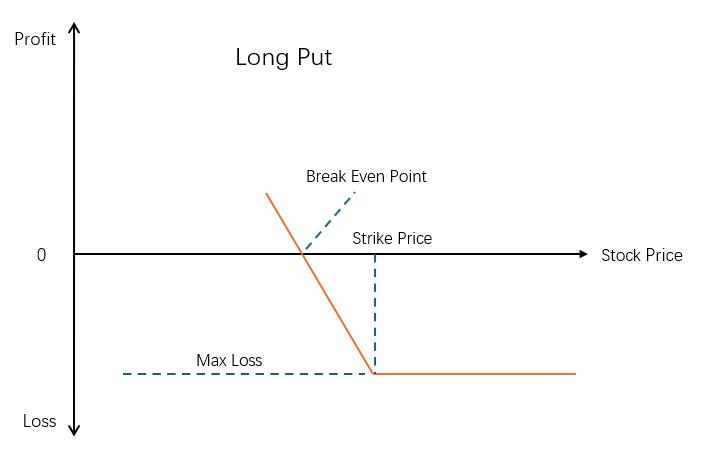
The break-even point is calculated as the strike price minus the premium, serving as the critical threshold for determining trade profitability.
The profit curve of a put option buyer exhibits a specific pattern: when the underlying asset price is below the break-even point, profits increase linearly as prices decline.
When prices exceed the break-even point, losses remain fixed at the total premium amount, reflecting the strategy's limited risk and limited reward characteristics. This payoff structure makes put options an effective risk management tool for investors anticipating market downturns.
Seller Profit/Loss Calculation
Put option sellers assume contractual obligations by collecting premiums, expecting the underlying asset price will not fall below the strike price. This strategy is suitable when anticipating stable or rising markets.
Put option seller P&L: [P – max(0, K – ST)] × Contract Size
Where:
ST = Underlying asset price at expiration
K = Strike price
C = Call option premium
P = Put option premium
Practical Example:
When selling a put option with a $110 strike price at a $7 premium (each contract representing 100 shares of the underlying asset), if the underlying asset price falls to $100:
Total profit = (7×100) - [(110-100)×100] = -$300
If the underlying asset price remains at $115, the seller retains the full $700 premium income.
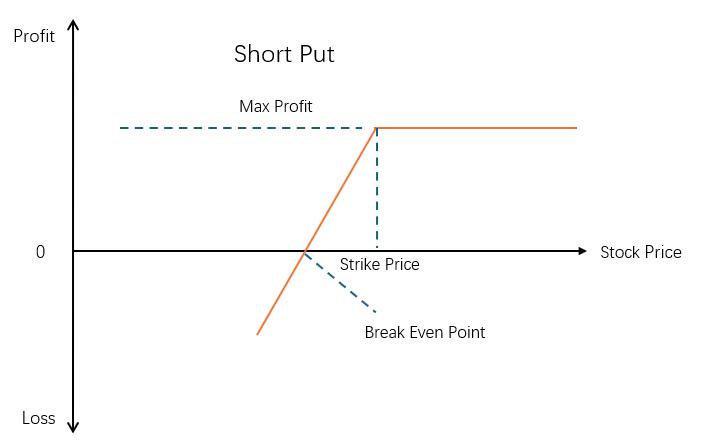
As shown in the chart, when the underlying asset price is above the break-even point, profits remain fixed at the total premium amount. When the price falls below the break-even point, losses expand as prices decline—this structure clearly demonstrates the risk exposure sellers face during market downturns.
Profit and Loss Influencing Factors in Options Trading
Profit and loss calculations in options trading rely not only on theoretical formulas but also require consideration of three often-overlooked practical factors—particularly crucial for novice traders.
Composition of Option Premium Affects Actual Costs
Option premium consists of intrinsic value and time value. Their dynamic changes directly impact trading outcomes. Time value decay exhibits nonlinear characteristics: during the first half of an option's life, decay progresses relatively slowly, but accelerates significantly in the second half. Particularly within the final 30 days, time value may rapidly approach zero.
This means that even with unchanged underlying asset prices, option premiums can decline substantially as expiration nears, potentially creating unrealized losses before expiration.
Comprehensive Impact of Trading Costs
Actual trading involves costs extending far beyond the visible option premium. Commission structures vary by brokerage, typically ranging from $1 to $5 per trade—a significant factor for small transactions.
More critically, capital gains tax calculations depend on holding periods and investor income levels. Assets held over one year generally qualify for lower long-term capital gains tax rates, while short-term holdings face ordinary income tax rates.
Additionally, certain ETFs and derivatives may trigger specialized tax regulations. Investors must incorporate these cost factors into profit calculations to accurately assess net returns and avoid overestimating performance by neglecting hidden expenses.
Margin Risk for Option Sellers
Margin requirements represent a critical risk factor for option sellers, functioning as performance guarantees demanded by brokers. These requirements are calculated based on underlying asset price volatility risk and adjust in real time during significant market movements.
If account balances fall below maintenance margin levels, investors receive margin calls and must replenish funds within specified timeframes. Failure to comply grants brokers the right to forcibly liquidate positions.
