


TradingKey - We have previously discussed some foundational charts and technical analysis indicators, but if you want to take your trading to the next level, you need to master more complex candlestick patterns.
What Are Some Advanced Candlestick Patterns?
How Does the Hikkake Pattern "Fish" for Traders?
The Hikkake pattern is a reversal configuration that comprises two candlesticks. Its uniqueness lies in its utilization of false price breakouts, specifically designed to "fish" for traders who tend to chase trends.
Typically, before this pattern appears, the market will experience a phase of low volatility with a slow-moving trend. Then, prices will suddenly "break out" above or below key support or resistance levels, seemingly initiating a new trend. Many traders rush to enter positions upon witnessing this breakout.
However, shortly after this occurs, the price shifts unexpectedly, trapping new market entrants. Their stop-loss orders are triggered, further driving prices to accelerate in the opposite direction.
You can think of it as a small trap set by the market intended to harvest profits from those who blindly chase trades. If you can identify it during its formation process, you might catch a genuine reversal opportunity instead.
.jpg)
(Source: Shutterstock)
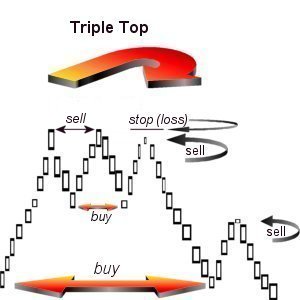
Triple Tops and Triple Bottoms: Classic Trend Reversal Signals
These two patterns are typical reversal signals, with one appearing at the end of an uptrend and the other at the end of a downtrend. They quietly tell you, "Hey, the trend might be coming to an end."
The triple top appears during an uptrend when prices attempt to rally to the same level three times but fail each time. This indicates that there is substantial pressure above and that buyers are exhausted.
Once the neckline formed by connecting the lows between the two peaks is broken — especially accompanied by increased volume — it presents a good opportunity to go short.
(Source: Wikipedia)
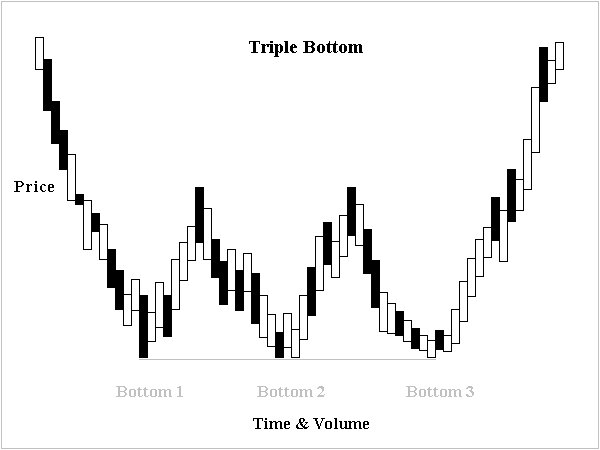
The triple bottom, on the other hand, occurs at the end of a downtrend when prices test lower support three times but fail each time, indicating that selling pressure is weakening.
When the neckline is effectively broken above, it often signals that a new bullish trend may be about to begin.
(Source: Wikipedia)
Smart traders will wait for prices to pull back to the neckline but fail to break through, allowing them to increase their positions with lower risk and higher odds.
This pattern appears quite similar to the double top (M pattern) and double bottom (W pattern) we discussed earlier; we can think of it as an upgraded version of those formations.
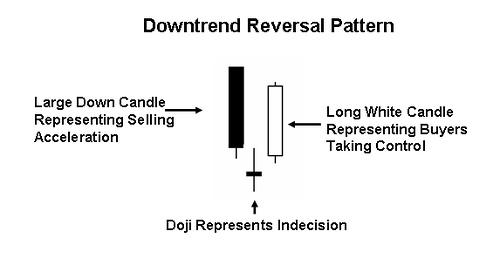
How Does the Morning Star Pattern Bring Hope?
The Morning Star is a well-known bottom reversal pattern that includes three candlesticks:
The first candlestick is a large bearish candle, indicating that the market is still in a downtrend.
The second candlestick features a small body, which can either be bullish or bearish, indicating a balance between buyers and sellers.
The third candlestick represents a robust bullish candle that closes well above the midpoint of the first, indicating that buyers have taken back control of the market.
(Source: Wikipedia)
Why Is It Worth Noticing?
The Morning Star often appears after a downtrend, akin to the glimmer of dawn, suggesting that darkness is about to pass and an upward move may be imminent.
If you can catch the signals in its formation process promptly, you might secure an excellent entry position.
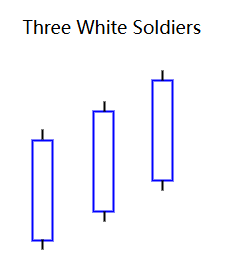
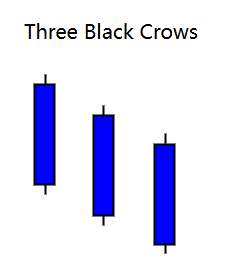
Three White Soldiers and Three Black Crows: A Concentrated Outburst of Bullish and Bearish Power
The next two patterns we'll discuss are signals formed by a sequence of three daily candlesticks.
In contrast to the Morning Star, which occurs solely at the conclusion of a trend, these patterns can occur in the early or mid-stages of a trend, reflecting considerable strength from one side.
Three White Soldiers consists of three consecutive bullish candlesticks, each closing higher than the previous day’s close, with very short upper and lower shadows.
This indicates a highly optimistic market sentiment dominated by buyers.
It typically occurs during consolidation after a downtrend or at the beginning of an uptrend, serving as a strong bullish signal.
(Source: Wikipedia)
Three Black Crows is made up of three consecutive bearish candlesticks, each closing lower than the preceding one and also having almost no upper or lower shadows. This signifies that sellers are fully unleashed and market confidence is rapidly deteriorating.
It is frequently observed at the conclusion of an uptrend or in sideways markets, serving as a cautionary bearish indicator.
(Source: Wikipedia)
What Do They Signify?
Three White Soldiers and Three Black Crows serve as flags on the battlefield, clearly displaying the power dynamics between bulls and bears. Upon observing them, you need to quickly assess market sentiment and make corresponding decisions.
What Are Some Complex Technical Indicators?
- Fibonacci Retracement
Fibonacci retracement is a valuable tool that many traders use to identify support and resistance levels. Its core idea is that prices do not move in a straight line up or down; there will always be some key retracement levels during a trend that deserve our attention.
It's not difficult to use. Simply identify a clear trend—whether it's upward or downward—and then apply the Fibonacci tool from the starting point to the endpoint.
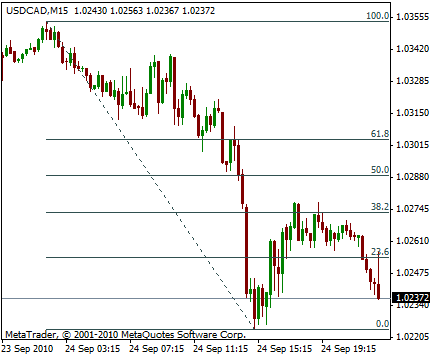
The system will automatically draw several key levels: 23.6%, 38.2%, 50%, 61.8%, and 100%.
The key levels of interest are 38.2% and 61.8%.
For instance, in an uptrend, if prices pull back and stabilize around the 61.8% level, it often indicates that bulls are beginning to gain momentum again and a new rally may be imminent.
Conversely, in a downtrend, these two levels become resistance points; if prices rebound here and face rejection, they will likely continue to decline.
Why Is It Important?
You can think of it as a place where the market "catches its breath," allowing you to assess whether it will continue in its original direction.
(Source: Wikipedia)
From the chart, we can see that the price rebound was halted at the 38.2% retracement level of an earlier decline.
- Bollinger Bands
How Are the Three Lines of Bollinger Bands Divided? What Are Their Functions?
Bollinger Bands consist of three lines: the middle band, upper band, and lower band:
Middle Band (MB)
The middle band is generally a 20-day simple moving average (SMA), serving as the "central axis" for price movement and reflecting the medium-term trend.
You can think of it as the market's "equilibrium point." When prices fluctuate around the middle band, it indicates that the market is in a relatively stable state.
Upper Band (UB)
The upper band is derived by adding two standard deviations to the middle band, which exerts upward pressure on prices.
When you see prices touch the upper band, it may suggest that the market has entered an overbought condition, implying a potential price pullback.
Lower Band (LB)
The lower band is calculated by subtracting two standard deviations from the middle band, providing support for prices.
When prices reach the lower band, it may suggest that the market is oversold, indicating a potential for a price rebound.
.jpg)
(Source: Shutterstock)
How to Gauge Market Sentiment Using Bollinger Bands?
Consider what it means when Bollinger Bands expand or contract. What signals are they implying?
When Bollinger Bands open upward and prices remain steadily above the middle band, it indicates that the market is in a strong uptrend. Bullish momentum prevails, supporting further price increases.
In such cases, you might consider taking a long position in alignment with the trend.
If Bollinger Bands open downward and prices fall below the middle band, it signals that bears are dominating current conditions.
Market sentiment leans towards pessimism, suggesting that prices may continue to decline.
When Bollinger Bands gradually narrow, market volatility decreases — similar to tranquility before a storm.
At this time, the market is likely brewing a new trend, whether upwards or downwards remains uncertain.
- EXPMA
EXPMA is an optimized version of traditional moving averages, characterized by its quicker response and reduced lag.
Typically, you will see two lines: a short-term EXPMA and a long-term EXPMA.
How to Interpret the Signals?
When the short-term line crosses above the long-term line from below, it creates a golden cross, which is a potential buy signal. Conversely, when the short-term line crosses below the long-term line, it forms a death cross, which may indicate a selling opportunity.
Unlike Bollinger Bands, EXPMA is not particularly adept at capturing volatility; however, it effectively helps determine whether a trend continues.
If you favor medium- to short-term trend-following trades, EXPMA can be a good choice.
- CCI
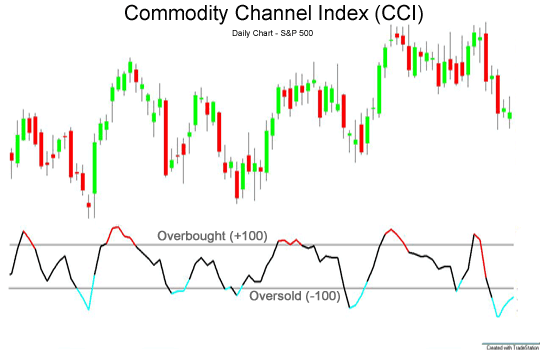
CCI (Commodity Channel Index) is a very practical indicator that is particularly suitable for identifying overbought and oversold conditions in the market as well as potential trend reversals.
How to Determine Overbought and Oversold Conditions?
If the CCI indicator exceeds +100, the market enters an overbought state, suggesting that prices may soon pull back, serving as a potential sell signal. If the CCI indicator drops below -100, it indicates that the market is in an oversold state, implying prices may soon rise and indicating a potential buy signal.
How to Observe Trend Reversals?
When the CCI indicator crosses down through the +100 line from above or crosses up through the -100 line from below, it often signals that the market trend may be reversing.
(Source: Wikipedia)
- DMI
DMI (Directional Movement Index) is a technical analysis tool used to measure the strength and direction of market trends. It consists of four lines: +DI, -DI, ADX, and ADXR.
What Do They Represent?
+DI: Reflects the strength of bullish forces; when the +DI line rises, it indicates that the market is in an uptrend.
-DI: Reflects the strength of bearish forces; when the -DI line rises, it suggests that the market may be in a downtrend.
ADX evaluates the strength of trends; a greater value indicates a stronger trend.
ADXR is a smoothed version of ADX that helps confirm trend stability.
How to Trade Using DMI?
When the +DI line crosses above the -DI line from below, it generates a buy signal, indicating that bullish forces are beginning to gain an advantage.
Conversely, when the -DI line crosses below the +DI line from above, it generates a sell signal, suggesting that bearish forces are strengthening.
What Is the Role of ADX?
When the ADX value continues to rise and is relatively high (e.g., above 30), it indicates that the market trend is strong. Traders may choose to maintain positions in currency pairs showing strong trends.
On the other hand, when ADX values decline, it may suggest that market trends are weakening and traders should be cautious regarding potential reversals.
- SAR
SAR (Stop and Reverse) is a very practical trend-following indicator. It helps you accurately set stop-loss and take-profit points during trend trading, effectively managing risk.
What Is Its Calculation Principle?
In simple terms, in an uptrend, SAR values will gradually rise and stay below prices as stop-loss levels.
In a downtrend, SAR values will gradually fall and remain above prices as stop-loss levels.
When prices are running above SAR indicators, it signifies that the market is in an uptrend; you might consider holding long positions. If prices fall below SAR indicators, it indicates a potential trend reversal—you need to promptly exit with a stop loss.
When prices are running below SAR indicators, indicating a downtrend, you can consider holding short positions. If prices break upward through SAR indicators, you should promptly close your position and take losses.