


SpaceX Stock Price Forecast: Morgan Stanley Maintains Overweight Rating, Sets $300 Price Target, Sees Over 100% Upside



AI Podcast


SpaceX shares have rebounded approximately 16% from a November 5 low to close at $139.94 on November 12 Eastern Time. Morgan Stanley maintains an Overweight rating and a $300 price target, highlighting a strategic shift toward robotics, mesh networking, and Physical AI infrastructure. However, execution risks remain tied to capital expenditure scaling and chip constraints. Technically, the stock is consolidating in a short-term recovery phase below key resistance at $143 and the 60-day moving average, with immediate support identified in the $130–$133 range and downside risk testing $120–$124 if support fails.

TradingKey - Recently, SpaceX shares (SPCX) entered a volatile recovery phase following a sharp pullback. As of November 12 Eastern Time, SPCX edged up 0.14% to close at $139.94, reaching an intraday high of $147.60 on volume of approximately 95.96 million shares; in the latest overnight trading, it briefly climbed back above $141. Compared to the interim low of $120.39 on November 5, the stock has rebounded about 16%, but there is still more than 100% upside potential to JPMorgan's $300 price target.
Morgan Stanley Maintains $300 Price Target, Eyes New Growth Curve After Neocloud
Morgan Stanley recently reiterated its Overweight rating and $300 price target on SpaceX. The bank believes SpaceX is gradually moving past the rapid expansion phase of its Neocloud business, with the company's future growth focus potentially shifting further toward robotics, mesh networking, and space infrastructure. Morgan Stanley estimates that by the end of 2027, SpaceX's computing capacity will be slightly above 8 GW, below the more than 13 GW target proposed by Musk, with key constraints including chips, power, and financing capacity. The bank also expects that as the business mix shifts, Neocloud's share of total revenue and profit may gradually decline.
Meanwhile, Morgan Stanley further views SpaceX as an infrastructure player in "Physical AI." The rationale is that as the deployment of robots and distributed AI devices increases, demand for computing, network connectivity, and low-latency data transmission is likely to expand, while Starlink, launch capabilities, and AI computing facilities position SpaceX to span connectivity, compute power, and space infrastructure. The bank estimates the addressable market for digital AI at approximately $30 trillion and believes the long-term addressable market for physical AI could be even larger. However, this valuation framework relies on the widespread adoption of robotics, declining space computing costs, and projects like Terafab progressing as planned; hence, the $300 price target primarily reflects long-term business expansion assumptions rather than near-term profitability.
From an execution standpoint, SpaceX continues to ramp up its AI infrastructure investment. The company recently unveiled plans to build supercomputing facilities in Texas and Arizona with a total investment exceeding $74 billion, while Morgan Stanley is closely watching the investment scale and construction progress of Terafab's next phase. Whether the stock can further digest the growth expectations implied by the $300 price target will largely depend on AI infrastructure utilization rates, the commercialization of the robotics business, and the pace at which capital investment converts into revenue and cash flow.
SpaceX Stock Price Technical Analysis
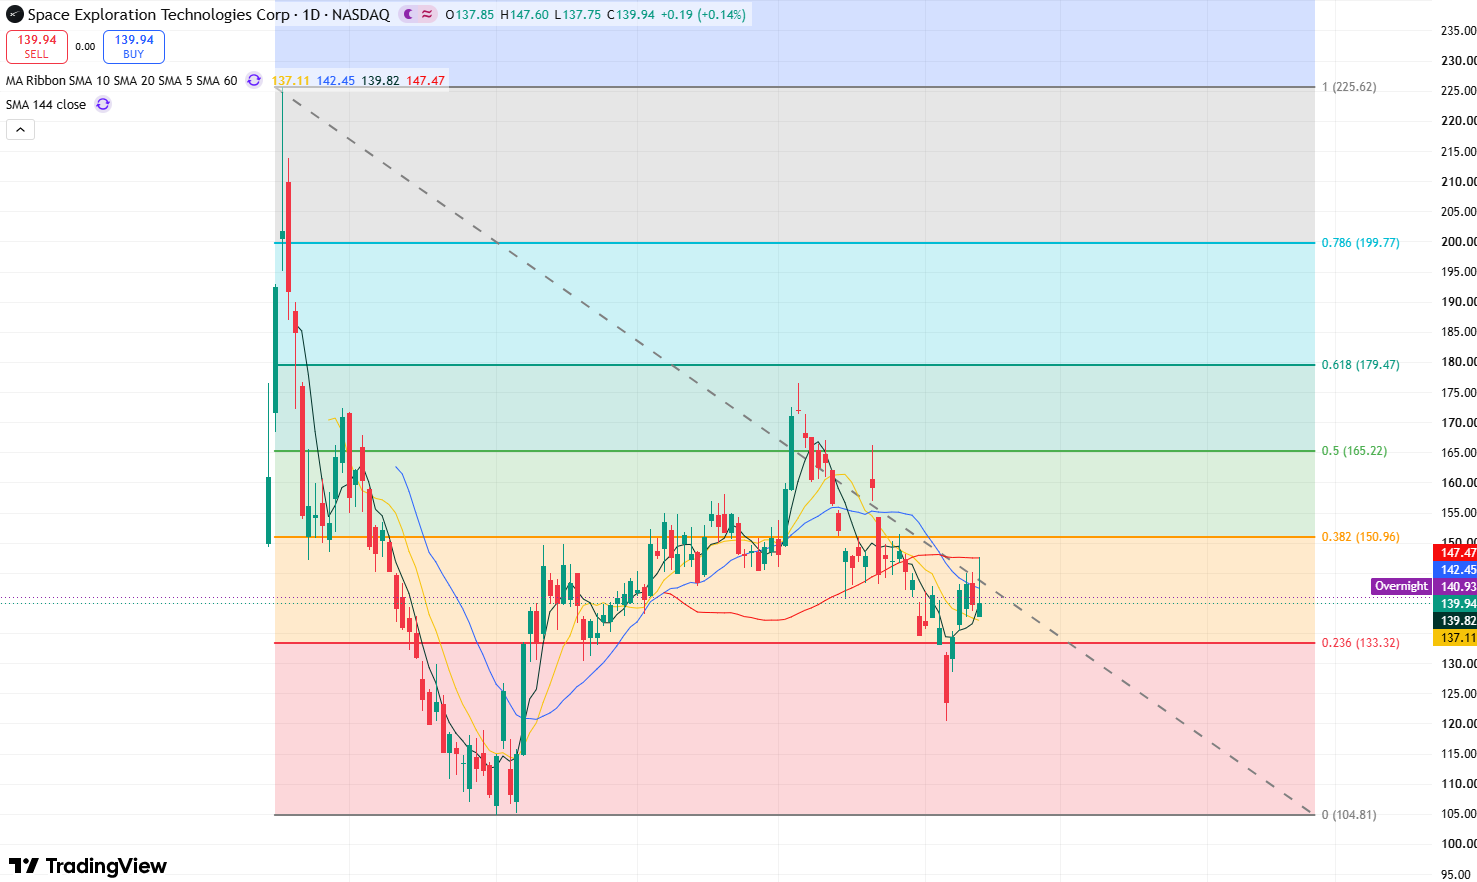
SPCX daily stock price chart, Source: TradingView
Judging from the daily chart of SPCX, the stock price rebounded sharply after falling to a low near $120 in early November and has now returned to around $140. However, it has not yet effectively broken above the key resistance level of $143, meaning the current trend remains in a recovery phase within a short-term downtrend.
In terms of moving averages, the 5-day moving average is currently around $139.82, the 10-day moving average is around $137.11, the 20-day moving average is around $142.45, and the 60-day moving average is around $147.47. The latest closing price of $139.94 has climbed back above the 5-day and 10-day moving averages, improving the short-term price structure. However, it remains below the 20-day and 60-day moving averages, indicating that the medium-term trend has not yet fully strengthened. Only when the stock price successfully breaks out and stabilizes above the 60-day moving average can the medium-term trend potentially reverse to an uptrend.
From the perspective of Fibonacci retracement levels, the $130-$133 area corresponds to the 0.236 retracement level of the previous rally and serves as key support formed during the recent rebound. If this zone holds, the stock still has room to test overhead resistance levels; if it breaks below this area again, the next support to watch will return to the $120-$124 range.
Currently, the stock price remains under short-term pressure below the key resistance level of $143. If it can effectively break above this level, it will open up continuation upside toward $150, with the next resistance at $165. Clearing this resistance would allow the stock to further challenge its Oct. 6 high of $176.42, and only a breakout above this level would pave the way for a test of the $200 mark or even its all-time high of $225.64.
This content was translated using AI and reviewed for clarity. It is for informational purposes only.
Recommended Articles







Comments (0)
Click the $ button, enter the symbol, and select to link a stock, ETF, or other ticker.