


Nvidia Stock Price Forecast: Michael Burry Says Jensen Huang’s Departure Could Weaken Supply Chain Dominance, Stock May Fall to $142



AI Podcast


Investor Michael Burry has doubled down on bearish bets against tech stocks, significantly increasing put options on the Nasdaq 100 and the VanEck Semiconductor ETF expiring in 2027. His short thesis centers on potential risks to Nvidia following Jensen Huang’s departure, questioning whether Nvidia can sustain its AI supply chain dominance and customer financing arrangements. Technicians note that Nvidia remains in a vulnerable, choppy phase with bearish moving averages, facing key resistance near $170 to $181 and downside risks toward $142 if support near $150 fails.

TradingKey - Michael Burry has once again increased his bearish bets on tech stocks, focusing on whether, following Jensen Huang's departure, Nvidia's (NVDA) influence over the AI supply chain can be sustained, and whether financing arrangements supporting customer chip purchases will contract.
Burry disclosed in a Substack post published on November 12 that he capitalized on the Nasdaq 100 Index's rebound from 27,000 to double his related put option position. The new contracts expire in early 2027, with a strike price roughly 20% below the index level at the time. In addition, he bought back 25% of the VanEck Semiconductor ETF (SMH) put option position that he had previously trimmed, with the contracts expiring in June 2027.
Jensen Huang Departs as Nvidia Supply Chain Influence Becomes Focus of Controversy
Burry noted that Jensen Huang's role extends beyond corporate management to Nvidia's resource coordination and commercial partnerships across the supply chain. With a leadership transition, this influence could diminish, potentially creating more competitive opportunities for Broadcom (AVGO) and Advanced Micro Devices (AMD).
If customers onboard alternative suppliers and negotiate more favorable procurement terms, Nvidia could face pressure on pricing power and gross margins even if it continues to generate revenue growth. Burry is looking for signs of its declining supply chain influence, though this assessment currently remains his investment hypothesis.
Financing is another potential transmission channel. Burry noted that Nvidia made approximately $42.4 billion in equity investments in the first half of 2026, meaning that for every $1 in revenue, roughly 30 cents was reinvested into AI infrastructure through equity investments. He believes some third-party financing platforms are also funding cloud providers' GPU purchases through special purpose entities.
Burry's concern is that a leadership change could dampen risk appetite, thereby slowing new investments. If it becomes harder for customers to secure financing, GPU procurement and data center deployments could be delayed, affecting Nvidia's future revenue realization.
Nvidia Technical Analysis
Nvidia is currently in a vulnerable, choppy phase, with its recovery of previous lows yet to stabilize. A prior sharp selloff dipped near $150 before rebounding above the previous spring low ($164.27), but the stock has now retreated below it again, indicating that buying support remains shaky.
The recent extreme low has not been breached again, meaning the current action represents a failed rebound following a breakdown, and a new downward breakdown cannot yet be confirmed. Currently, $164.27 remains the core pivot level to monitor whether it can be reclaimed with follow-through buying support.
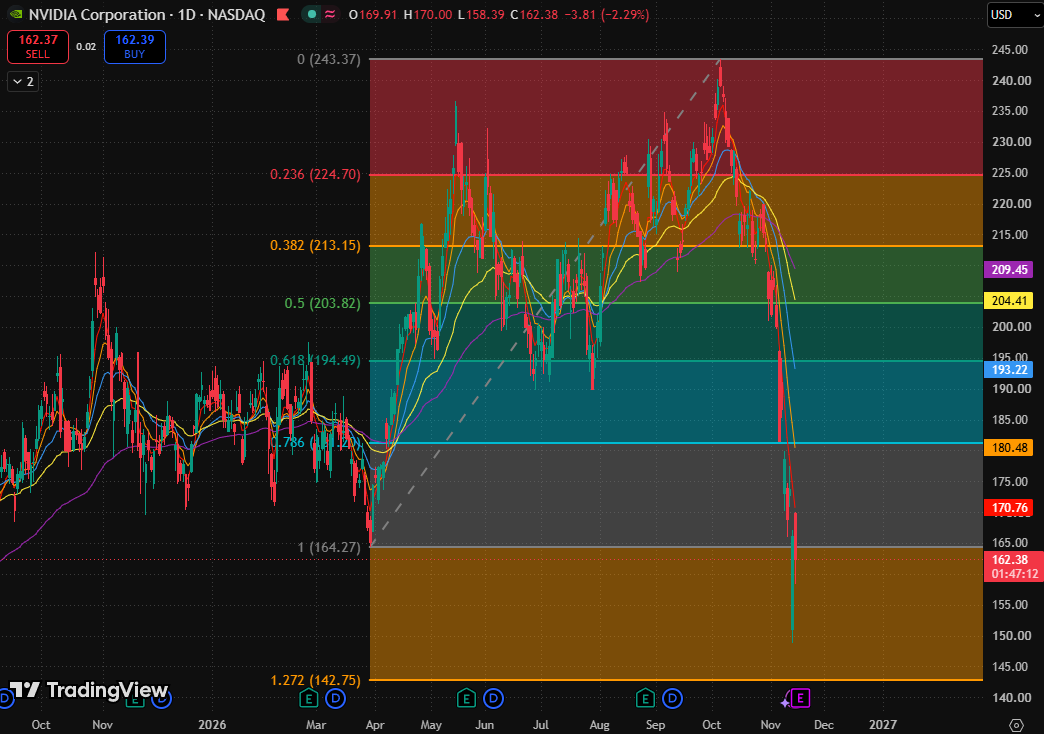
Nvidia stock chart, Source: TradingView
Currently, the five moving averages remain in a full bearish alignment, and the price has yet to reclaim any of them; the bounce has not altered the moving averages' overall weak technical backdrop.
In terms of rebound potential, if the stock firmly reclaims $164.27 and holds on a pullback, it could kick off a new round of recovery. Overhead resistance lies at the 5-day exponential moving average ($170.88); higher resistance is concentrated in the $180.54–$181.20 range formed by the 10-day exponential moving average and the 0.786 Fibonacci retracement level.
If the daily chart breaks below the recent extreme low near $150 and subsequently fails to recover, downside extension risks will escalate further. A breakdown below that level could lead to a decline toward the 1.272 Fibonacci extension level ($142.75).
This content was translated using AI and reviewed for clarity. It is for informational purposes only.
Recommended Articles









Comments (0)
Click the $ button, enter the symbol, and select to link a stock, ETF, or other ticker.