


AMD Stock Price Forecast: BofA Sees Agentic AI Driving Server CPU Growth, Shares Could Reach $600



AI Podcast


On November 13 ET, AMD shares tumbled over 10% intraday following a 44% rebound. Bank of America reaffirmed its Buy rating and raised its price target to $700, citing agentic AI as a major catalyst that will expand the 2030 global server CPU market to over $240 billion. BofA projects AMD’s server CPU revenue to reach $84.4 billion by 2030, driven by product and supply advantages. Technically, the stock is testing support near the $530.31 Fibonacci level and a clustered moving average band. Holding these levels is critical to sustaining the recovery toward $603.65, while a breakdown risks deeper correction toward $500.05.

TradingKey - On November 13 ET, Advanced Micro Devices (AMD) shares tumbled more than 10% intraday today after an approximately 44% rebound. Bank of America stated that agentic AI will expand CPU demand, and AMD's product and supply advantages are expected to drive concurrent growth in revenue and market share. The bank raised its price target from $650 to $700, up about 7.7%, maintained its "Buy" rating, and continued to name AMD its top pick in the server CPU space.
Compared to chatbots that primarily generate content, agentic AI must plan tasks, call tools, and execute multi-step workflows. These operations increase demand for task scheduling, memory management, and data processing, elevating the value of CPUs in AI systems and creating a new market for standalone CPU servers.
BofA therefore raised its forecast for the global server CPU total addressable market in 2030 from approximately $210 billion to over $240 billion. Of this, demand related to agentic AI is projected to surge from about $6.8 billion in 2026 to $105 billion in 2030, becoming a key driver of growth.
For AMD, the tailwinds stem not only from market expansion but also from market share gains. BofA expects the company's server CPU sales to grow from $18.5 billion in 2026 to $84.4 billion in 2030, representing a compound annual growth rate of about 46.2%, while its revenue share is projected to rise from roughly 29% to 35%, outpacing the broader industry.
The product portfolio is key to supporting this view. BofA believes AMD holds advantages in high operating frequencies and high core counts: the former helps enhance the operational efficiency of AI clusters, while the latter can support more concurrent agent tasks. The fifth-generation EPYC Turin features up to 192 cores, and the next-generation Venice will reach up to 256 cores. Advanced process nodes and supply assurance are also expected to help the company secure orders.
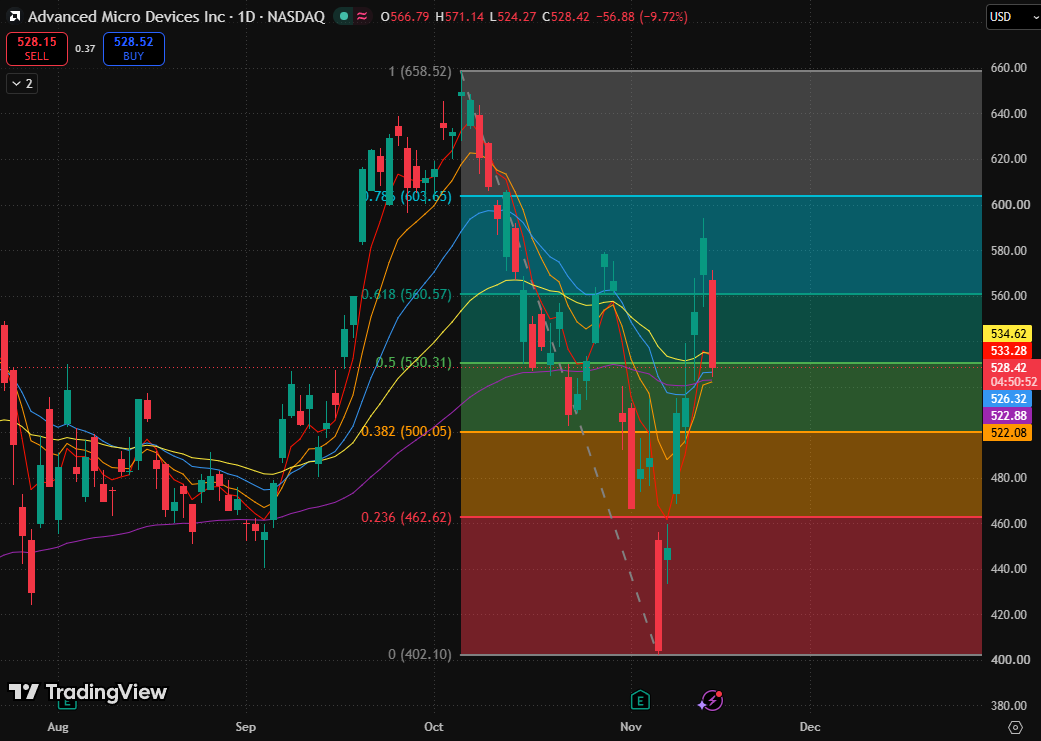
From a technical perspective, AMD opened lower and retreated after consecutive rebounds, with the current price slipping below the 0.5 Fibonacci retracement level ($530.31) as the rebound enters a support-testing phase. The stock has not yet broken below the underlying moving average support band, preserving some recovery gains; however, whether the halfway mark can hold has seen repeated tests.
At present, assessments should center around $530.31, which is the pivot level that needs to be reclaimed. A brief intraday dip below it does not equate to a confirmed breakdown on a closing basis, nor should this single bearish candlestick alone be taken as confirmation that the entire rebound is over.
AMD Stock Chart, Source: TradingView
Regarding moving averages, the 5-day exponential moving average ($533.57) has curled downward, with the price falling back below it; the 10-day exponential moving average ($522.24) and 20-day exponential moving average ($526.40) continue to rise, and the current price remains above both. The 80-day exponential moving average ($534.66) is flat to weak, while the 160-day exponential moving average ($522.90) is edging slowly higher. The five moving averages are clustered near $522–$535 with intertwined cycles, displaying neither a full bullish alignment nor a full bearish alignment.
Going forward, if the daily chart regains and stabilizes above the confluence zone of $530.31–$534.66 and finds support on pullbacks, the recovery is poised to continue. Next, observe the $560.57–$571.14 region formed between the 0.618 Fibonacci retracement level and the intraday high. The next target after that would be the 0.786 Fibonacci retracement level ($603.65).
On the downside, the primary risk is that the dense moving average support band is convincingly broken on a daily closing basis and turns into resistance on a retest. In that scenario, this pullback would shift from testing the halfway mark to a deeper correction, with initial support watched near $500.05. A secondary risk is that the price reclaims the halfway mark intraday but falls back below it by the close, forming a false breakout. If the 5-day exponential moving average continues to press downward while the rebound fails to overcome the overhead confluence resistance zone, the short-term recovery could turn into range-bound trading under pressure.
This content was translated using AI and reviewed for clarity. It is for informational purposes only.
Recommended Articles








Comments (0)
Click the $ button, enter the symbol, and select to link a stock, ETF, or other ticker.