

War, Oil Prices and Computing Power: The Rising Cost Floor Beneath the AI Bull Market


AI Podcast
The conflict in the Strait of Hormuz has created a structural increase in energy prices, impacting global supply chains. This disruption is not a temporary shock, as evidenced by persistent supply shortfalls, lingering risk premiums, and ongoing rerouting costs. These factors are driving up costs for fertilizers, food, and energy-intensive industries like data centers, due to factors including natural gas price increases and helium supply constraints. This sustained inflation pressure complicates central bank policy, potentially leading to slower rate cuts and affecting asset valuations. Gold may benefit from rising inflation expectations and geopolitical risk premia. The article suggests most of these economic impacts are not yet fully priced into markets.

In early March this year, global markets were fixated on one thing: the U.S. and Israel launched military strikes against Iran’s leadership, Brent crude shot above 80 dollars, and equities shuddered. Then came news of a cease-fire, oil prices pulled back slightly, markets exhaled, and headlines quickly moved on to the next story.
Many people assumed that was the end of it.
But there is one development that almost no one has been seriously tracking: the Strait of Hormuz has still not returned to truly normal traffic.
This strait, less than fifty kilometers across at its narrowest point, is the world’s most critical energy chokepoint. Roughly 20% of global oil flows through it, along with about one quarter of global LNG (liquefied natural gas) shipments under normal conditions. After fighting broke out, vessel traffic plunged from roughly a hundred ships a day to, at one point, single digits, and oil flows of about 20 million barrels per day were cut in half or more. As of early April, a large number of tankers and bulk carriers were still being forced to reroute around the Cape of Good Hope, adding 10 to 15 days to each voyage and driving freight costs sharply higher.
The cease-fire may have been announced, but actual traffic through the strait has only partially recovered.
So this article is not about replaying how the war was fought. It is about tracing how that half-blocked strait will quietly rewrite a lot of things over the next year or two—from oil fields, to the groceries in your kitchen, to the world’s most expensive data centers, and ultimately to the numbers printed on your asset statements.
That chain is much longer than most people realize. And precisely because it transmits slowly, it is most likely to be underestimated.
Why “Temporary Shock” Is A Misunderstanding?
Every time a geopolitical event pushes up oil prices, markets tend to have the same reflex: whatever spikes will eventually fall back; once the war ends, everything will be fine.
Sometimes that intuition is right. But this time, three things are different, and each is worth spelling out.
First, the supply shortfall has already occurred—and it cannot simply be made up.
In the weeks after hostilities began, as shipping through the Strait of Hormuz ground to a near halt and storage tanks filled up, major Gulf producers were forced to cut at least 10 million barrels per day of output in March alone, while more than 3 million barrels per day of refining capacity was shut because finished products could not be moved. The barrels that were supposed to reach the market will not magically reappear just because a cease-fire has been declared.
According to monthly data from the International Energy Agency, global oil supply contracted sharply in March, and global inventories fell by around 85 million barrels, flipping the market from mild surplus at the start of the year to a clearly tighter balance. Multiple institutions now frame this as a structural loss of supply and estimate that even if the conflict de-escalates quickly, several million barrels per day of capacity may be hard to fully restore for a long time due to damaged facilities, dismantled export systems, and tighter financing conditions.
Second, the risk premium has its own inertia; it does not vanish with a cease-fire headline.
Goldman Sachs estimated in an early-March report that about 18 dollars per barrel of risk premium was already embedded in oil prices, roughly corresponding to the market pricing in a six-week full closure of the Strait of Hormuz. That premium does not drop to zero the moment a cease-fire document is signed. It persists until the market truly believes that traffic through the strait is both normal and secure. In a conflict without a clear end framework, that confidence will take a long time to rebuild. In other words, as long as the strait’s status remains murky, this ten‑plus dollars of premium will stick to oil prices, regardless of whether the news cycle says the fighting has stopped or not.
Third—and most easily overlooked—rerouting costs are real and still accruing.
Every ship forced to go around the Cape of Good Hope racks up extra fuel costs, insurance, and crew time. Those costs are gradually baked into the price of whatever cargo is on board, then seep into the cost structures of every industry that relies on that supply chain. A cease-fire can stop the shooting, but it cannot instantly stop the rerouted ships, nor the bills for going around. Reorganizing the global shipping network is a matter of months, not weeks.

Source: CNBC
Taken together, these three factors make the conclusion clear: the floor under this round of energy prices has already been permanently raised by a notch. The question is how much higher, not whether it is higher at all. That higher floor will slowly diffuse through the entire economic system over the next year or two, along several different channels, and show up in places you probably do not expect.
The chapters that follow trace those channels.
From Oil Fields to Your Grocery Basket
Hormuz does not only carry oil—something many people have never really thought about.
It also carries the raw materials for food: fertilizers.
Thanks to cheap natural gas, the Gulf region has become a global hub for urea and synthetic ammonia exports. Countries such as Iran, Saudi Arabia, Qatar, the United Arab Emirates, and Egypt together account for roughly 30% to 40% of global urea exports and play a pivotal role in nitrogen fertilizer and ammonia trade. To reach the world’s farms, the vast majority of these fertilizers must travel by sea, and roughly one-third of seaborne fertilizer shipments—including about one-third of global seaborne urea and synthetic ammonia—are effectively forced to pass through the Strait of Hormuz. During the most chaotic weeks of the conflict, this corridor was, in practice, shut: cargoes were either stuck in port or forced to reroute, and the supply chain was put on pause.
For farmers, fertilizer is not something you can casually run out of. The planting window is only a few months; once it passes, it is gone. That means you either buy at whatever price you must pay, or you cut application rates and accept lower yields. Either choice ends up in food prices.
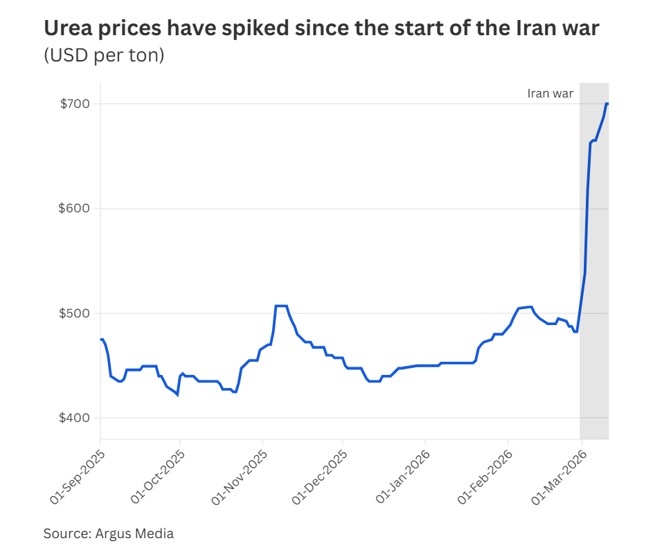
The data are already speaking. After fighting broke out, international fertilizer prices spiked within weeks. Take FOB urea prices in the Middle East and Egypt as benchmarks: they jumped from about 400–500 dollars per ton before the war to over 700 dollars, a rise of roughly 50% to nearly 100% depending on the starting point. Nitrogen fertilizer and ammonia prices climbed sharply as well, with some nitrogen products reported up around 40% versus pre‑war levels. In the United States, urea prices at the Port of New Orleans increased by more than a quarter in a single month, visibly raising local farmers’ cost of cultivation. Bloomberg and others have started running special coverage on a fertilizer crisis, and some agricultural analysts have said bluntly in interviews that this could be worse than 2022.
Source: CNBC
Many people still remember how grocery prices surged in 2022. Back then, the Russia‑Ukraine conflict combined with tight European natural gas supply. Natural gas is the main feedstock for synthetic ammonia, so nitrogen and fertilizer prices skyrocketed, and the UN’s FAO Food Price Index hit a record high. The logic this time is strikingly similar: a critical supply chain breaks, fertilizers become more expensive, farm production costs rise, and grain prices follow. The difference is that this time the main character is shipping through Hormuz, not the Nord Stream gas pipeline.
Within the cost structure of grains, nitrogen fertilizer is already the largest single input. Goldman Sachs estimates that nitrogen accounts for around 20% of grain production costs, and in highly intensive farming regions the share is even higher. For other staple crops, fertilizer also has a significant weight. This latest surge in fertilizer prices will materially raise agricultural production costs over the coming months and, through prices of wheat, corn, soybeans, and other staples, feed into a broader inflation basket. Europe faces an even more complicated situation; it must cope with shocks from Hormuz while still being partially dependent on Russian gas and fertilizers, meaning two critical supply lines are shaking at once.
Food price increases hit low‑income countries far harder than developed economies, because food takes a much larger share of household budgets. This round of inflation will not stop at the price tags on supermarket shelves. It will spread along global supply chains, gradually transporting the shock from Hormuz into every country that relies on imported grains and fertilizers.
At this point, the first transmission chain is in place: higher oil prices → higher transport costs → higher fertilizer prices → higher grain production costs → higher food prices → stickier inflation. This is not a prediction; it is already happening. Most people simply have not yet traced the line from oil fields all the way to their own grocery baskets.
From Oil Fields to the World’s Most Expensive Data Centers
We have talked about your food bill; now let us talk about the bill for computing power.
At first glance, a war in the Middle East seems to have nothing to do with Silicon Valley’s data centers. In reality, their connection is more direct than most imagine, and it appears in two completely different places: electricity costs and a gas called helium.
First, power bills.
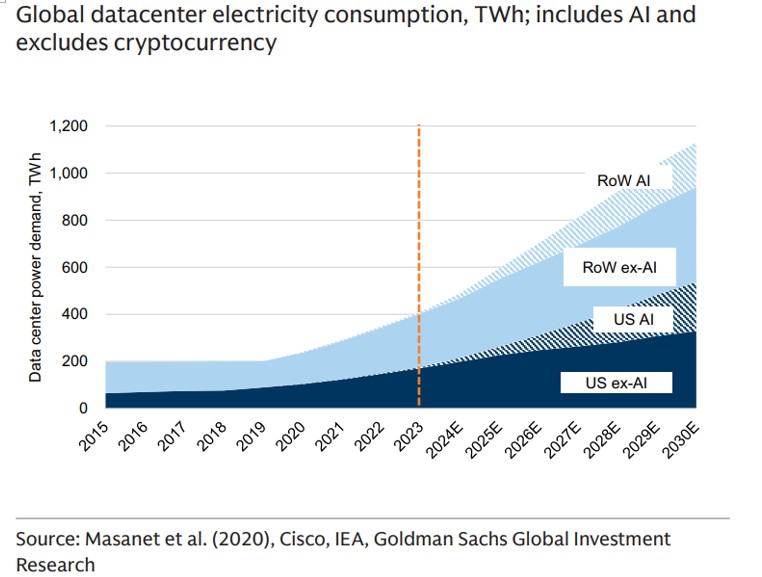
Power demand from AI data centers is now one of the fastest‑growing sources of electricity consumption globally. In a forecast update released in early 2026, Goldman Sachs raised its projection for data‑center electricity demand growth by 2030 from 175% above 2023 levels to 220%. Put plainly, in less than a decade the world is essentially creating a new country whose power consumption would rank among the global top ten—and that country does only one thing: run AI.
Source: Goldman Sachs
Where does that electricity come from? The vast majority of data‑center power still comes from national grids that, in many major markets, remain dominated by fossil fuels. Coal and gas‑fired plants are still the essential backbone stabilizing power systems. Even if renewables grow rapidly over the next few years, the IEA expects data‑center electricity demand to at least double between 2022 and 2030, and beyond wind, solar, hydro, and nuclear, grids will still have to lean heavily on natural gas and even some coal to balance the system.
Now back to Hormuz. Roughly one quarter of global LNG normally passes through this strait on its way to Europe and Asia. In the days following the outbreak of fighting, European benchmark natural gas prices spiked by almost 30% in a single session as markets repriced the risk of supply disruption. More expensive gas means higher generation costs for gas‑fired power plants, which in turn raises the electricity bills that data centers rely on. Over the past two years, electricity prices in many major economies have risen faster than overall inflation, particularly in regions with dense data‑center clusters, and AI‑driven power demand and energy tensions are expected to keep adding upward pressure to core inflation in coming years. After the Iran conflict escalated, that pressure only grew, not shrank.
Now to helium—an obscure material for most people, but indispensable for AI chips.
Helium is a non‑substitutable input in semiconductor manufacturing. It is used to cool wafers during etching, as a carrier gas to prevent metal oxidation, and for precision leak detection in chip‑making equipment. There is currently no industrial‑scale substitute. It is a necessity, not an option.
Source: Finshots
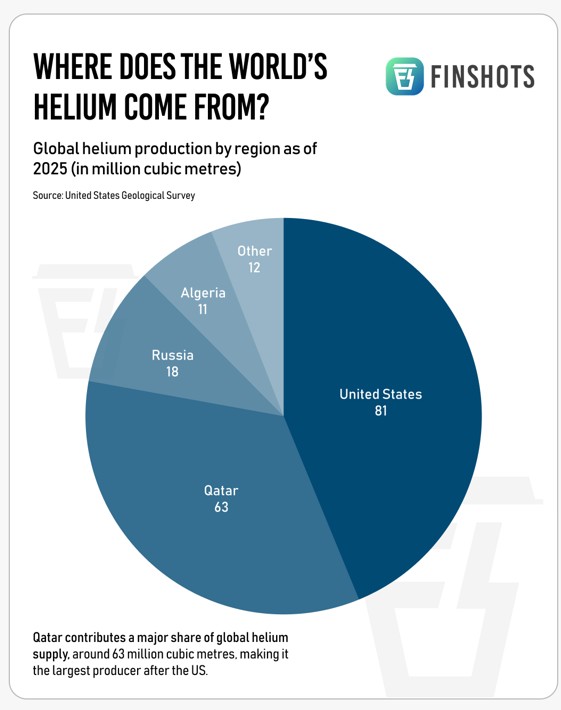
Qatar is one of the world’s largest helium producers, supplying an estimated 30% to 35% of global demand. In March, Iranian strikes on energy infrastructure in the Gulf disrupted part of Qatar’s LNG capacity, and helium is recovered as a by‑product of LNG production. Combined with constrained shipping through Hormuz, that means roughly one‑third of global helium supply suddenly found itself on the brink of disruption. Major helium suppliers have issued force majeure notices to downstream customers; in mid‑March, Airgas, one of the largest packaged‑gas distributors in the U.S., said it was cutting monthly helium allocations for some customers to 50% of normal levels and raising surcharges.
A detail makes this even trickier: liquid helium is difficult to store stably for long periods and usually must be used within weeks to a few months. The cargoes stuck en route will gradually boil off; they will not wait around for the supply chain to fully recover. Samsung Electronics and SK Hynix moved early, boosting helium inventories before the conflict escalated. According to Korean officials and suppliers, together they hold about four to six months of supply, gaining some buffer. But if production and shipping in the Middle East cannot normalize within that window, the next step will be genuine supply gaps. Many industry experts warn that some damaged production lines could take years to fully repair and that the helium market may remain tight or even in chronic shortage for an extended period.
Fortune magazine captured the issue bluntly: the AI economy runs on helium, and the Iran war has just exposed 650 billion dollars of AI investment to a new risk factor. The ORF Middle East think tank was even more direct, asking whether the Iran war has already triggered the next semiconductor crisis.
Put the two threads together—power bills and helium—and you can see the real connection between this war and AI: AI is not a costless productivity miracle. It is extremely energy‑intensive and heavily dependent on rare materials, and this time both of those pillars were shaken at once.
That gives us the second transmission chain: the raised floor for oil prices → more expensive natural gas → higher generation costs → rising data‑center electricity bills; and at the same time, Iran’s attacks on Gulf infrastructure cut Qatar’s helium output and choked shipping lanes → constrained chip manufacturing → physical bottlenecks to AI compute expansion emerge in the real world. The war may never touch a single server directly, but it hits the electricity bills and the chip supply chain—and quietly rewrites the economics of AI in the background.
Central Banks Forced into A Dilemma
The first three parts dealt with real‑world bills: oil, food, AI power, and chip costs. Add them up and they will change macroeconomic trajectories in a very concrete way, because they all feed into the same number: inflation.
Inflation is at the core of central‑bank decision‑making and the axis around which all asset pricing ultimately revolves.
At the start of this year, the market’s base‑case script looked fairly comfortable: inflation drifting lower, the Fed preparing to cut rates gently in the second half, a soft landing for the economy, and tech stocks continuing to rally. After the Iran conflict erupted, that script became much harder to sustain.
The reason is not one single enormous shock but three separate lines pushing in the same direction: a higher floor under oil, food prices in the pipeline, and structurally rising power costs for AI. Each line alone might look modest; taken together, they make a quick return to 2% inflation far less plausible than it seemed six months ago. Capital Economics now explicitly notes that the conflict has made the 2026 inflation path harder to predict and skewed toward upside risks compared with expectations at the beginning of the year.
That puts central banks in a very uncomfortable squeeze.
Cut rates too quickly, and they will be accused of letting inflation flare back up; everyone still remembers the cost of the Fed being a step behind in 2021–2022. But if they keep rates high, corporate borrowing costs will stay elevated, and AI‑infrastructure projects whose returns were calculated on the assumption of rapid rate cuts will have to redo their math, slowing investment. IDC’s analysis is clear: higher energy prices are the first channel through which the war is hitting the tech sector, and data centers, fabs, and advanced manufacturing are all highly energy‑intensive. Even a moderate increase in power costs can cap overall IT‑budget growth.
This is not a problem with a textbook right answer. It is the real situation central banks will face in the second half of this year: fewer arguments for cutting, but growing costs to not cutting. The most likely outcome is a slower pace of rate cuts than markets expected in January, with each move contingent on the latest CPI print and far less certainty about the policy path.
For asset markets, slower‑than‑expected easing is a very specific shock, and it hits hardest exactly where valuations are highest and concentration is most extreme. High‑growth tech stocks are extremely rate‑sensitive, because their value rests on discounting profits many years in the future. A slightly higher discount rate can slash the present value of those cash flows. At the moment, these names make up nearly 40% of the S&P 500’s market cap—an unprecedented level of concentration.
From the battlefields in Iran, to the Strait of Hormuz, to fertilizers and food, to AI power bills and helium, to inflation, to central banks, to tech‑stock valuations—this entire chain is built on actual events already unfolding, not on guesses.
What This Map Means for Gold Holders
Gold is linked to this energy shock through two independent routes, both pointing in the same direction.
The first runs through inflation expectations.
The first four sections have essentially described a process in which the floor under inflation is being raised. This is not a one‑off CPI spike in a single month, but oil, food, and power bills all creeping higher at the same time, making it harder to push inflation down than markets expected earlier in the year.
There is a well‑established, empirically tested relationship between gold and real interest rates: they move in opposite directions. When inflation expectations rise and central banks cannot or will not hike aggressively to offset them, real rates are pushed lower. Lower real yields reduce the opportunity cost of holding gold, making it more attractive. By late April, the U.S. one‑year real rate implied by TIPS was around 0.4%–0.5%, lower than before the conflict. If upcoming data confirm that the inflation floor really has moved higher, this mechanism will only strengthen.
In a note earlier this year, Swiss private bank UBP highlighted the same point: falling real rates are one of the key drivers of the current gold bull market, and the mix of geopolitical conflict plus sticky inflation is tailor‑made to keep real rates depressed.
The second route runs through geopolitical risk premia.
Gold’s reaction to the war was almost reflexive. In the two days around the initial headlines, gold prices rose by about 5.2%, with intraday highs near 5,246 dollars per ounce. Historical data compiled by Goldman Sachs show that during periods of acute Middle East tension, the correlation between gold and oil prices has been around 0.6—much higher than in normal times. The logic here is not oil up, so gold up, but that the same environment of uncertainty supports both.
What matters is that these two channels are independent yet reinforcing. Short‑term geopolitical premia will ebb and flow with cease‑fire news, but the raised inflation floor is a slow‑burn dynamic that does not reverse with a single announcement. It is embedded in fertilizer prices, freight rates, and every power bill. It will take several quarters’ worth of CPI prints for markets to fully grasp it.
That is the core difference between this article and the simplistic war breaks out, buy gold narrative. Short‑term sentiment premia are obvious, heavily traded, and short‑lived. The more enduring benefit comes from a structural lift in the inflation floor. That line moves slowly but steadily—and it is precisely the kind of thing markets are worst at pricing in advance.
By the time this round of inflation data is confirmed, markets will be left scrambling to reprice.
What Has Not Yet Been Priced in Is What Matters Most
After all of this, the central observation can be put in one sentence:
Most of the war’s real economic shock has not yet been priced in.
Markets flinched briefly in early March, then calmed as cease‑fire headlines appeared and quickly reverted to familiar narratives. They have mostly been trading the probability of escalation and the timing of cease‑fire agreements, not carefully digesting several stubborn realities: the Strait of Hormuz is still not fully reopened; the fertilizer crisis is still building; and the helium supply gap could take years to repair.
This is not a complaint about market irrationality; markets always price what they can see in the near term. The real issue is that the knock‑on effects that take quarters or years to fully surface are almost destined to be underpriced at the beginning of the story.
Every node on this transmission map—oil, shipping, fertilizers, grains, power bills, helium, inflation, interest rates, tech valuations—is backed by data and has momentum to keep transmitting. When the next food‑price CPI print surprises to the upside; when the next Fed press conference hints that the pace of cuts will slow; when the next quarter’s AI‑company capex guidance comes down because of energy costs, many people will ask: where did this come from?
The answer is already marked out along this chain. Most people have just not put the pieces of the map together yet.
This article is for investor education only and does not constitute investment advice. All data cited are from public sources; past performance is not indicative of future results.
Recommended Articles


Comments (0)
Click the $ button, enter the symbol, and select to link a stock, ETF, or other ticker.