

Amazon Stock Pullback: Is This Decline a Buying Opportunity or a Risk Signal?


AI Podcast
Amazon's stock exhibits a robust fundamental outlook, evidenced by resilient revenue and margin growth, with its cloud business as a key driver. Significant capital expenditure in AI and cloud infrastructure, while pressuring short-term cash flow, is strategically positioning the company for long-term earnings optimization and competitive advantage in AI applications. Technical analysis indicates the stock is in a consolidation phase within an overall bullish trend, supported by an inverse head and shoulders pattern suggesting increased short-term momentum. Investors are advised to consider valuation against medium-to-long-term growth, employing precise trading strategies.

TradingKey - Recently, Amazon ( AMZN) shares have seen a significant pullback, but the overall upward trend remains intact.
Fundamentals
From a fundamental perspective, the signals released in this latest earnings report lean toward robustness. Both revenue and margins have maintained a certain level of resilience, with annual net sales achieving year-on-year growth. Notably, the cloud business continues to maintain double-digit expansion, which is particularly critical—it signifies that the core growth engine is still running rather than relying on temporary factors. Meanwhile, the company's capital expenditures on infrastructure have accelerated significantly, focusing on AI and cloud computing-related fields. While these investments may indeed exert some pressure on profit margins and free cash flow in the short term, from a longer-term perspective, they are effectively restructuring the revenue mix while gradually optimizing future earnings elasticity and marginal returns.
The current market discussion is largely focused on the incremental opportunities brought by AI. As generative AI and large model applications gradually migrate to the cloud, the strategic advantages of Amazon Web Services in computing power supply and self-developed chips (such as Trainium and Inferentia) are beginning to be repriced. Some institutions have a relatively clear outlook: if these underlying capabilities can be successfully converted into commercial scenarios, they will bring not only scale expansion but, more importantly, an improvement in the profit structure. Research firms including Needham also tend to believe that the return cycle for this type of AI infrastructure investment is long, but the certainty is gradually increasing. In other words, short-term fluctuations in free cash flow are essentially laying the groundwork for higher-quality growth in the future, and based on current business progress, this logic has already begun to materialize.
As for the stock performance, it is continuously pricing in these shifting expectations. Recent adjustments to price targets and ratings by some investment banks have directly translated into increased volatility on the charts. However, the market is not moving in a single direction; some capital is beginning to focus on the alignment between valuation and medium-to-long-term growth, suggesting that current pricing may not fully account for future earnings expansion potential. Such divergence in expectations often amplifies short-term volatility, demanding higher precision in trading timing. For short-to-medium-term participants, relying solely on news flow can lead to a reactive position; a more effective approach is to combine volume changes with key technical levels to make judgments, participating in swing trades while controlling risk, rather than frequently chasing highs and selling lows driven by emotion.
Technicals
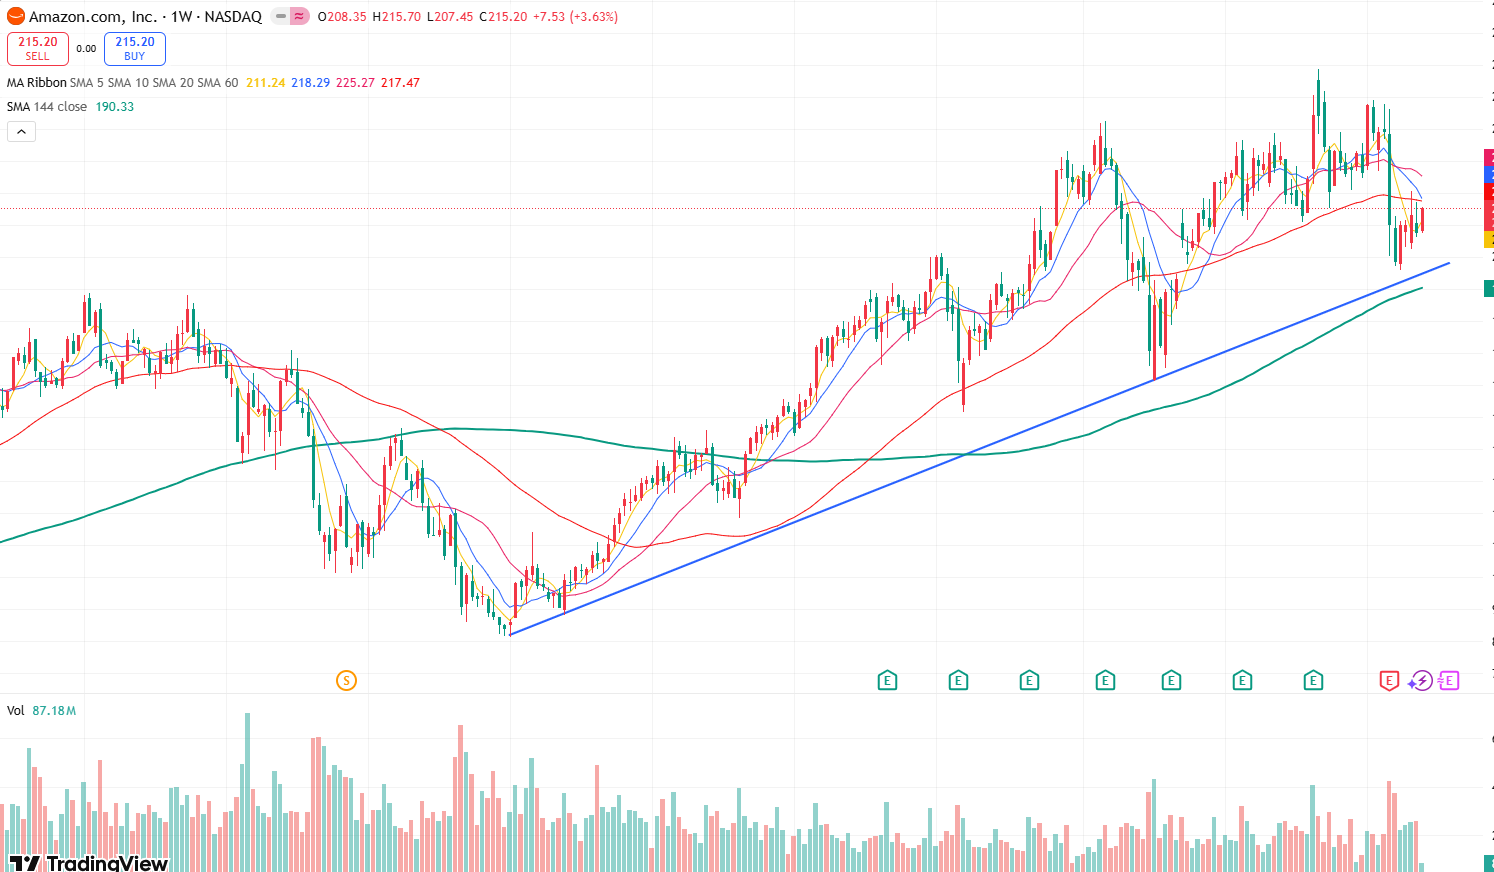
Source: TradingView
Looking at the weekly chart, although Amazon's stock price has experienced a significant pullback recently, it has not broken the weekly upward trendline, indicating that the overall trend remains bullish and is currently just in a consolidation phase following the previous rally.
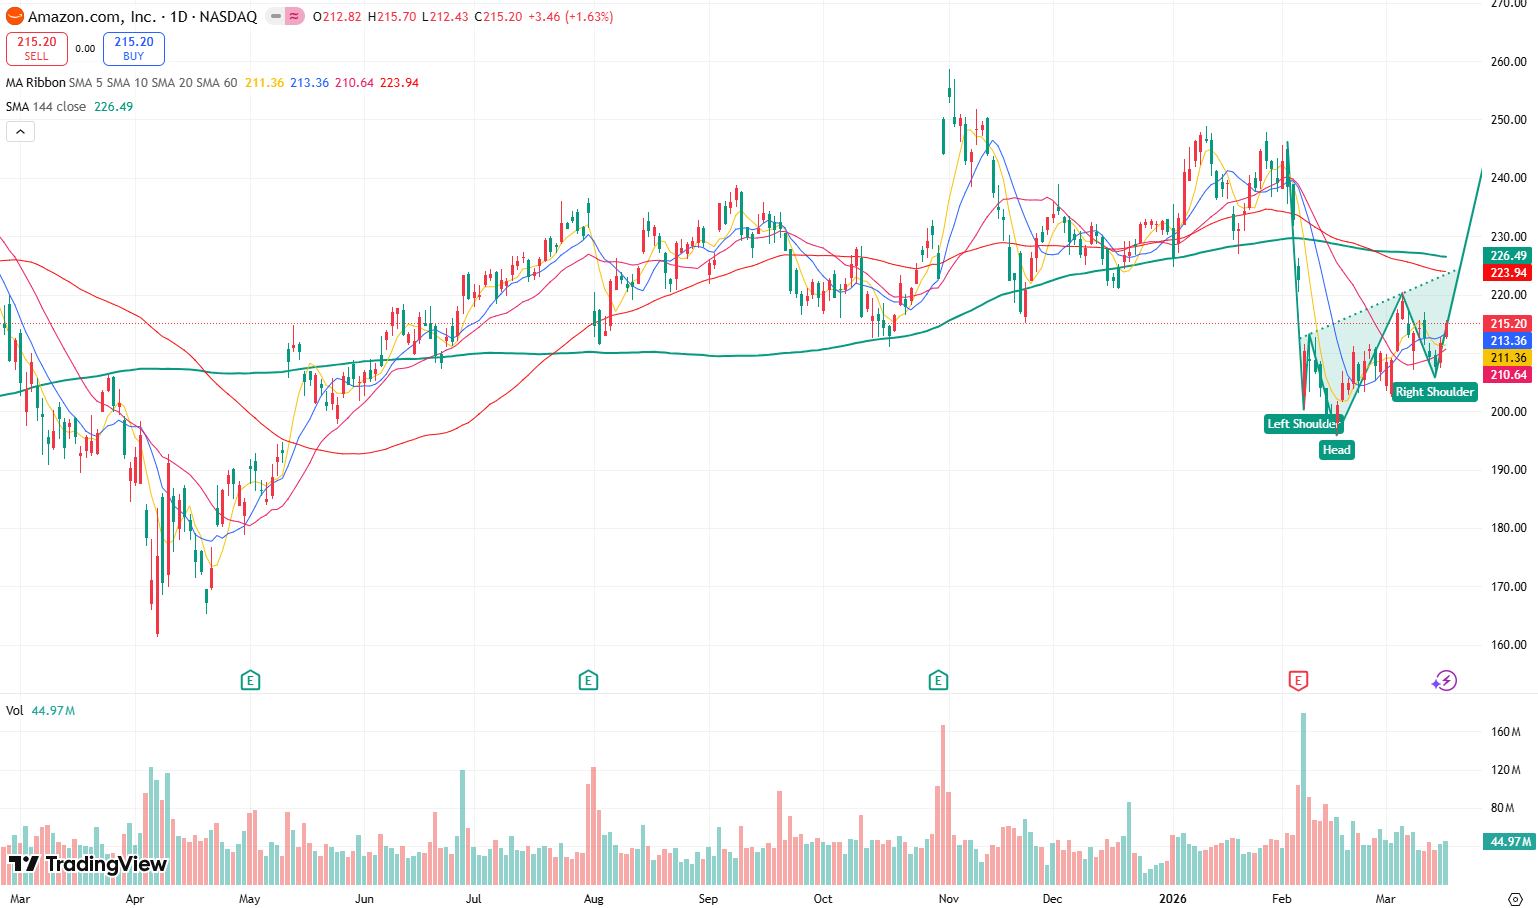
Source: TradingView
From the daily chart, Amazon's candlestick structure has formed an inverse head and shoulders pattern. With the neckline at 212.80 being breached and the price holding above 200.30 on a retest, the formation of this pattern suggests that short-term bullish momentum has been significantly strengthened. The first upside target is expected to break above 249.00.
Support levels: 200.30, 196.00
Resistance levels: 226.88, 249.00
Recommended Articles


Comments (0)
Click the $ button, enter the symbol, and select to link a stock, ETF, or other ticker.