

The $600 Billion End Game: 2026 Global AI Giants Capital Efficiency and Earnings Quality Quantitative Audit Report


AI Podcast
The global tech industry in 2026 has shifted from 'investment as growth' to 'output as value' due to intense capital expenditure on AI infrastructure. A new evaluation system highlights the importance of Incremental Operating Margin, Revenue Conversion Velocity, Free Cash Flow Coverage, and Asset Burden Ratio. Alphabet (Google) leads with a score of 8.7 due to self-developed chips and high conversion velocity. Meta (8.0) shows strong margins but plateauing momentum. Microsoft (5.4) faces asset-heavy pains, while Amazon (4.7) shows bottom reversal potential. Oracle (2.7) is in a vulnerable position with high leverage and low cash flow.

The Evolution of the Macro Paradigm in 2026: A Turning Point from 'Vision Consensus' to 'Zero-Sum Game'
As of the first quarter of 2026, the competitive landscape of the global technology industry has undergone a profound paradigm shift. The massive computing power arms race that began in 2024 has finally reached its 'judgment day' for capital output efficiency after two years of irrational expansion. The sharp drawdown of nearly 60% in Oracle’s stock price from its peak, along with Microsoft’s market value contraction following the disclosure of its $100 billion spending plan, signals that market pricing logic has shifted from 'investment as growth' to 'output as value'.
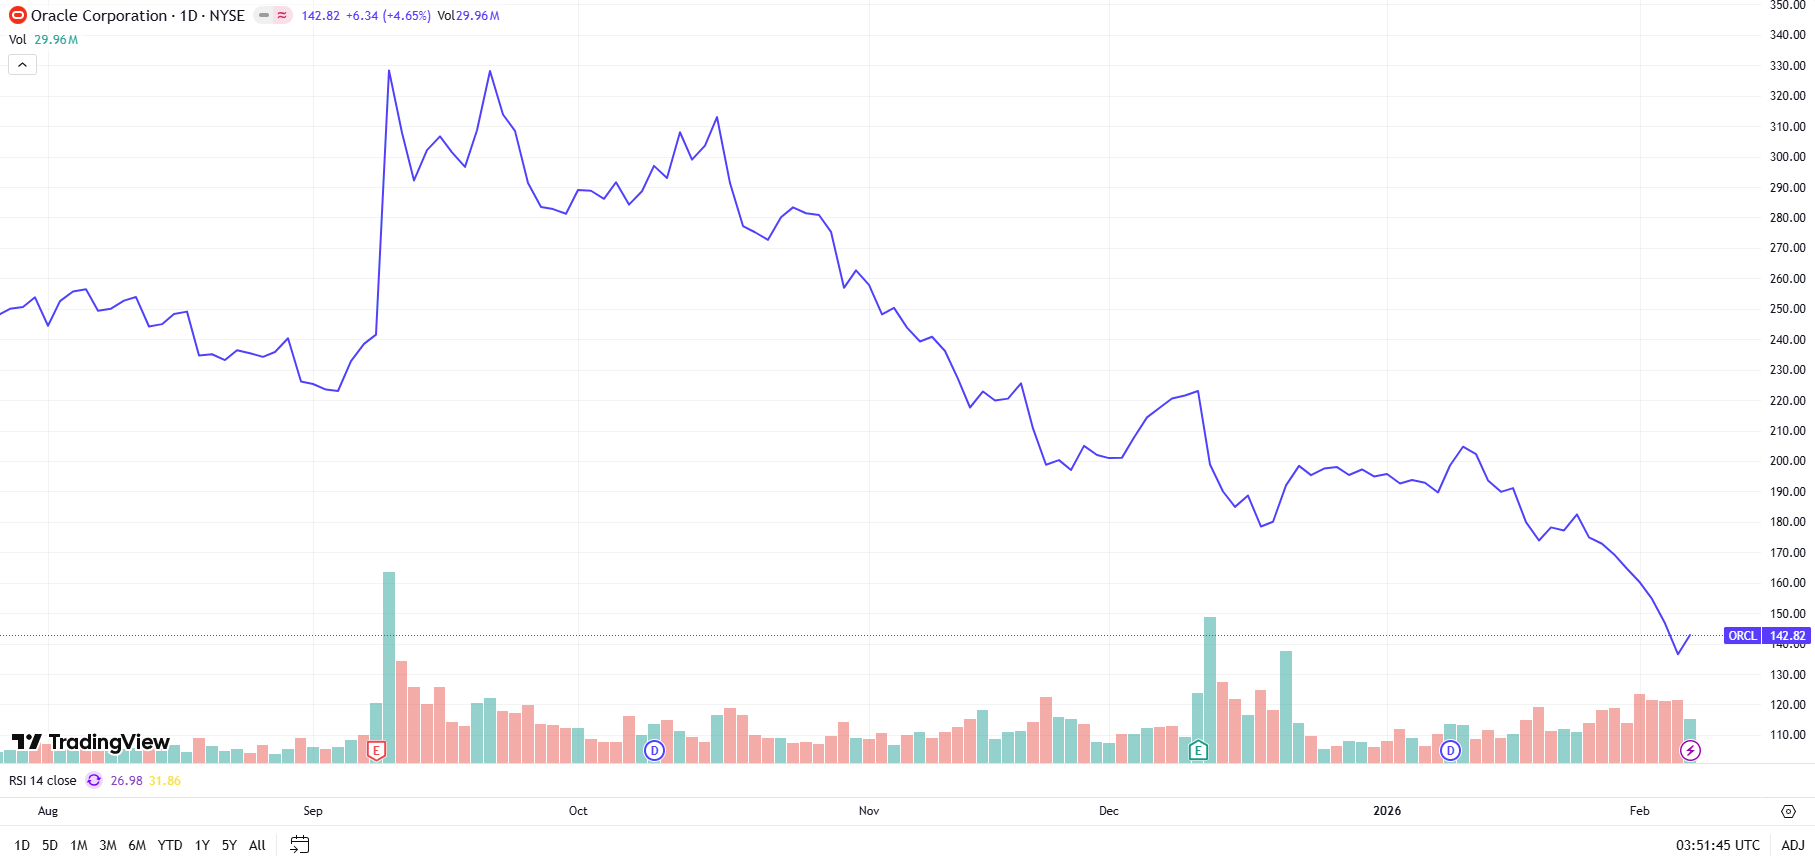
Source: TradingView
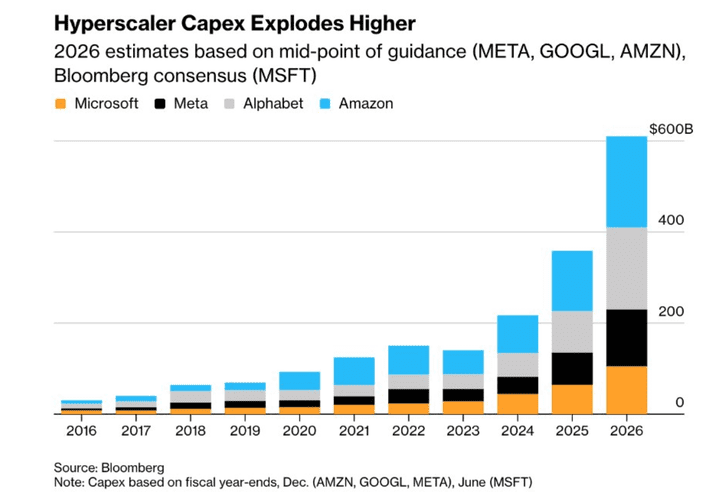
As the combined annual capital expenditures (CapEx) of Amazon, Google, Meta, and Microsoft cross the $600 billion threshold, the core focus for investors is no longer the parameter scale of large models, but rather the marginal contribution of these investments to the income statement. Under the triple squeeze of high inflation, high energy costs, and high interest rates in 2026, the operating leverage of tech giants is undergoing an unprecedented stress test. The construction of AI infrastructure is not just a consumption of capital, but a comprehensive test of corporate liquidity, tolerance for technological depreciation, and execution of monetization paths. This article aims to establish a quantitative audit system based on dynamic changes over the past eight quarters to distinguish which companies are building cost moats and which are falling into the 'asset-heavy' profit-eating trap during this extreme expansion cycle.
Core Quantitative Evaluation System: Defining the 'Survival Red Line' for Tech Stocks in 2026
In the current capital-intensive phase of competition, traditional price-to-earnings (P/E) ratios or simple revenue growth rates no longer fully reflect the strategic security of giants. This study employs a trailing twelve-month (TTM) data methodology to construct a weighted assessment model across four dimensions:
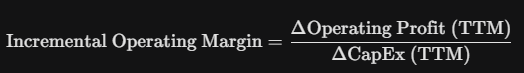
Incremental Operating Margin (Weighting: 40%): This is the ultimate metric for measuring the core efficiency of the AI machine. It answers a brutal question: against the backdrop of a year-on-year surge in capital investment, is every unit of new investment translating into actual profit, or is it being cannibalized by high costs for electricity, computing power leasing, and R&D? Data shows that the incremental margins for Google and Microsoft reached 53.20% and 58.90%, respectively, representing the cost-pass-through capabilities of top-tier giants under economies of scale.
Revenue Conversion Velocity (Weighting: 25%): Considering there is usually a lag of about six months from computing power deployment to its final conversion into cloud revenue, this metric measures a company's ability to anticipate and fulfill market demand. For instance, Google's high conversion velocity of 92.00% indicates extremely low idle rates for its infrastructure, with investments feeding back into revenue quickly.

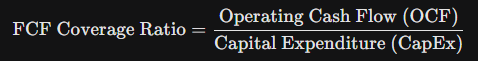
Free Cash Flow (FCF) Coverage Ratio (Weighting: 20%): Determining whether a company possesses organic investment capabilities. In a high-interest-rate environment, 1.0x is considered the survival red line. It defines whether a company is 'investing in the future with money it earned' or relying on financing to maintain 'hemorrhaging expansion.' Oracle's coverage ratio of only 0.65x suggests a lack of financial margin for error in an extremely volatile environment.
Asset Burden Ratio (Weighting: 15%): This metric warns of the 'manufacturing-ization' trend in tech stocks. The depreciation cycle for AI hardware is extremely short; if the ratio of depreciation and amortization to revenue is too high, companies will lose the high-margin attributes of software firms. Microsoft's current burden ratio of 14.63% is significantly higher than Google's 4.91%, reflecting the heavy book impairment pressure brought by its massive data center construction.

Static Metric Assessment: Financial Fractures and Structural Contrasts Among Giants
Through a static data scan of five benchmark companies, we have identified significant strategic divergence:
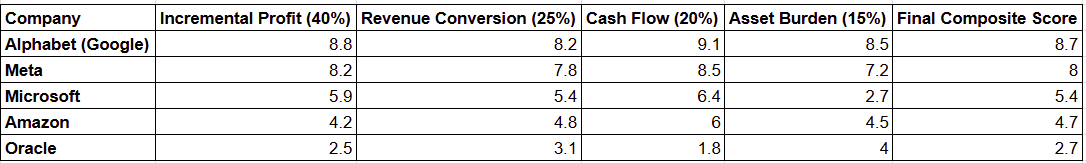
- Alphabet (Google) [Final Score: 8.7]: By hedging the high premiums of third-party procurement with self-developed TPU chips, its asset burden ratio is only 4.91%, while its revenue conversion velocity is as high as 92.00%, demonstrating benchmark-level health across all dimensions.
- Meta [Final Score: 8.0]: Zuckerberg's transformation after the 'Year of Efficiency' has yielded significant results, with incremental operating margins maintained at 42.18%, and its AI ad recommendation system showing extremely high monetization efficiency.
- Microsoft [Final Score: 5.4]: Microsoft is facing severe growing pains from its transition to an asset-heavy model. Despite an incremental margin of 58.90%, the high asset burden ratio of 14.63% and a cash flow coverage ratio of 1.28x indicate that its profit margins are being eroded by rising infrastructure depreciation.
- Amazon [Final Score: 4.7]: Its incremental margin of 21.60% is diluted by its massive retail business, but a revenue conversion velocity of 74.00% and a cash flow coverage ratio of 1.05 have held the fundamental baseline.
- Oracle [Final Score: 2.7]: All metrics are in the danger zone. Its incremental margin is only 9.70%, and its FCF coverage ratio is just 0.65x, reflecting the fragile nature of its reliance on external financing to support expansion.
Dynamic Momentum Observation: Predicting Large Capital Flows from Trend Slopes
Static scores are merely a historical 'physical exam report,' whereas in the extremely volatile market of 2026, the 'slope' and 'acceleration' of metrics are the core for predicting large capital reallocations and safe-haven behavior. Changes in the momentum slope directly reflect a company's marginal efficiency in the computing power track.
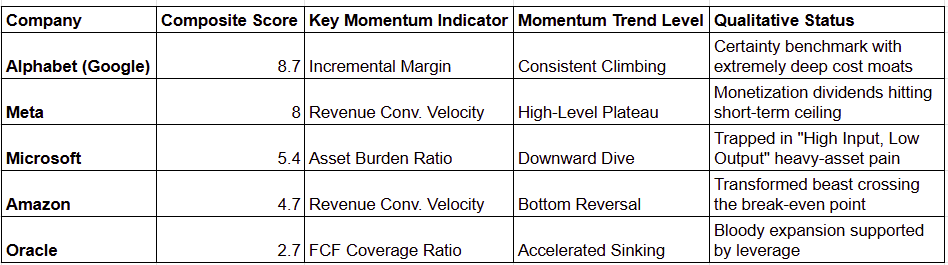
- Continuous Ascent: Alphabet (Google): Google not only won the static test, but its key metric, 'incremental margin,' remains at a momentum level of continuous ascent. The underlying logic is the 'cost decoupling' brought by the scaling of Google's self-developed TPU chips. While other competitors are still constrained by the price-hike cycles of third-party hardware supply chains, Google has achieved non-linear resonance between computing costs and revenue growth. The sustainability of this momentum defines it as a 'certainty benchmark with a deep cost moat.'
- Plateauing at High Levels: Meta: Meta's momentum slope has shown a plateauing trend in recent financial reports. Although its score of 8.0 remains excellent, the stagnation in revenue conversion velocity momentum suggests that the marginal returns of social media AI ad recommendations are approaching a short-term ceiling. For large capital, a flat momentum slope is usually a specific signal for profit-taking or shifting to a wait-and-see approach.
- Bottom Reversal: Amazon: Amazon exhibits the most contrasting momentum characteristics: a bottom reversal. While its static score of 4.7 is below the passing line, the slope of its revenue conversion velocity has turned upward. This marks that Amazon's massive prior investments in logistics automation and AWS infrastructure have crossed the most difficult depreciation adjustment period, transforming it into a 'disguised beast' unleashing powerful growth potential.
- Nosediving: Microsoft: Microsoft's current momentum status is extremely dire, characterized as 'nosediving.' The rising slope of its 14.63% asset burden ratio has significantly outpaced the growth in profit conversion efficiency. This 'metric divergence' indicates that Microsoft is deeply mired in the whirlpool of 'asset-heavy growing pains.' Large capital usually remains highly vigilant toward such momentum trajectories until there is a significant V-shaped recovery in profit conversion efficiency; otherwise, its valuation will remain under pressure.
- Accelerated Sinking: Oracle: Both cash flow and profit momentum are in a state of stalling, a typical manifestation of fundamental collapse supported by leverage.
Final Business Verdict: Survival Logic and Ultimate Destinies of Three Types of Players
Through a comprehensive evaluation of quantitative and qualitative factors, AI participants in 2026 have been divided into three distinct business schools, which determine their upper limits of risk resistance over the next 12 months.
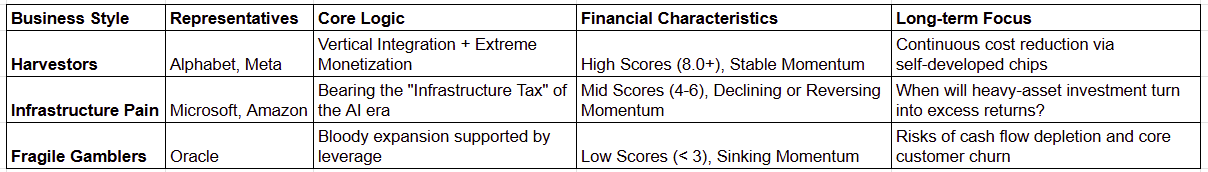
The Reapers (Alphabet, Meta): Vertical Integration and Ultimate Monetization
The core competitiveness of this school lies in its 'closed-loop' business model. Google maintains control over the computing power layer through self-developed chips, while Meta achieves rapid monetization of AI computing power through existing ad recommendation scenarios. Their common characteristics are stable momentum and scores above 8.0. In the 2026 environment, Reapers do not need to tell stories about the 'future'; they are building a cost moat that others cannot cross using economies of scale, acting as the true AI tax collectors in the market.
The Infrastructure Pains School (Microsoft, Amazon): A Heavy Tax of the Era
Microsoft and Amazon currently play the role of infrastructure builders for the AI era, which requires them to bear a high 'infrastructure tax.' Microsoft is facing an uphill climb during its transition period, while Amazon is on the eve of its harvest period. For this school, the key observation point is when asset-heavy investments can fully translate into excess returns. Their stock price drawdowns are often not business failures, but a market repricing of profit dilution during the 'asset-heavy' process.
The Vulnerable Gamblers (Oracle): Hemorrhaging Expansion Supported by Leverage
Oracle is a typical vulnerable gambler. With a free cash flow coverage ratio of only 0.65x, it still relies on high leverage to support its hemorrhaging expansion, with momentum showing 'accelerated sinking.' The business logic of such companies is highly dependent on the financing environment and the continuity of orders from key major clients. In a high-interest-rate environment, their margin for error is extremely low, and they face chain risks of cash flow breakage and core client loss at any time.
Returning to the Red Lines of Certainty
The AI stress tests of 2026 are not intended to negate the long-term value of tech giants, but rather to establish a rational framework that cuts through the financial fog. The momentum generated by data is merely the result, while the hidden cards of business decisions are the variables that change the result. When the market falls into emotional panic, investors should return to these three red lines: incremental profit, conversion velocity, and the bottom line of cash generation.
We are in an era where 'data doesn't lie, but logic can mislead.' The difference between Microsoft's passing grade and Google's high score is essentially the time gap in the depreciation cycles of two strategic paths. In this era of hundred-billion-dollar gambles, only by seeing who possesses the most authentic and healthy evolutionary momentum can one anchor ultimate value amidst the ruins of a crash. When logic is rigorous enough, panic disappears, replaced by a deep conviction in the essence of business.
This content was translated using AI and reviewed for clarity. It is for informational purposes only.
Recommended Articles


Comments (0)
Click the $ button, enter the symbol, and select to link a stock, ETF, or other ticker.