

Samsung, SK Hynix Shares Double: Which ETF Should Investors Choose for the Memory Chip Supercycle?


AI Podcast
Memory chip ETFs offer Asian investors exposure to a booming sector, with South Korean ETFs like TIGER Semiconductor TOP10 and KODEX Semiconductor providing high "memory purity" through substantial holdings in Samsung Electronics and SK Hynix. Japanese ETFs focus on equipment and materials, while Taiwanese options blend local tech with Korean giants. Hong Kong offers cross-regional and leveraged products. Returns are driven by underlying asset appreciation, currency fluctuations, and premiums. Key risks include memory cycle duration, investment concentration, and exchange rate volatility, particularly for cross-border products. Investors should align ETF selection with their market outlook and desired strategy.
TradingKey - As of the market close on May 15, share prices of Samsung Electronics and SK Hynix have risen 125.6% and 179.42% year-to-date, respectively. Amid the memory chip supercycle, ETFs are becoming a primary tool for capturing this rally. For Asian investors, what memory chip ETF options are currently available for allocation?
What are active ETFs? What are passive ETFs?
Active ETFs rely on fund managers to select stocks independently, aiming to outperform benchmark indices; these funds carry higher fees, and their performance is contingent upon the manager's discretion. Conversely, passive ETFs track a benchmark index, with holdings and weightings mirroring the index's movements; they are characterized by lower expense ratios and transparent holdings, yielding returns that essentially align with the index.
The distinction lies in the fact that passive strategies capture average market returns with lower costs and greater certainty, whereas active strategies seek alpha (excess returns), offering more flexibility but requiring a higher degree of professional judgment.
What are Leveraged ETFs, Pure Beta ETFs, and Covered Call ETFs?
Leveraged ETFs are exchange-traded funds that use financial derivatives and debt instruments to amplify the daily returns of an underlying index (e.g., 2x or 3x).
Pure Beta ETFs aim to track an index, where holdings and returns move in sync with the index without any additional hedging or enhancement strategies.
Covered Call ETFs regularly sell call options while holding underlying shares, collecting premiums as additional cash flow for distribution to investors. The trade-off is that if the share price surges past the strike price, the excess gains accrue to the option buyer, capping the ETF's upside.
Pure Beta captures the full market upside, while Covered Calls trade that for steady cash flow. Choose the former if bullish and the latter for flat or volatile markets.
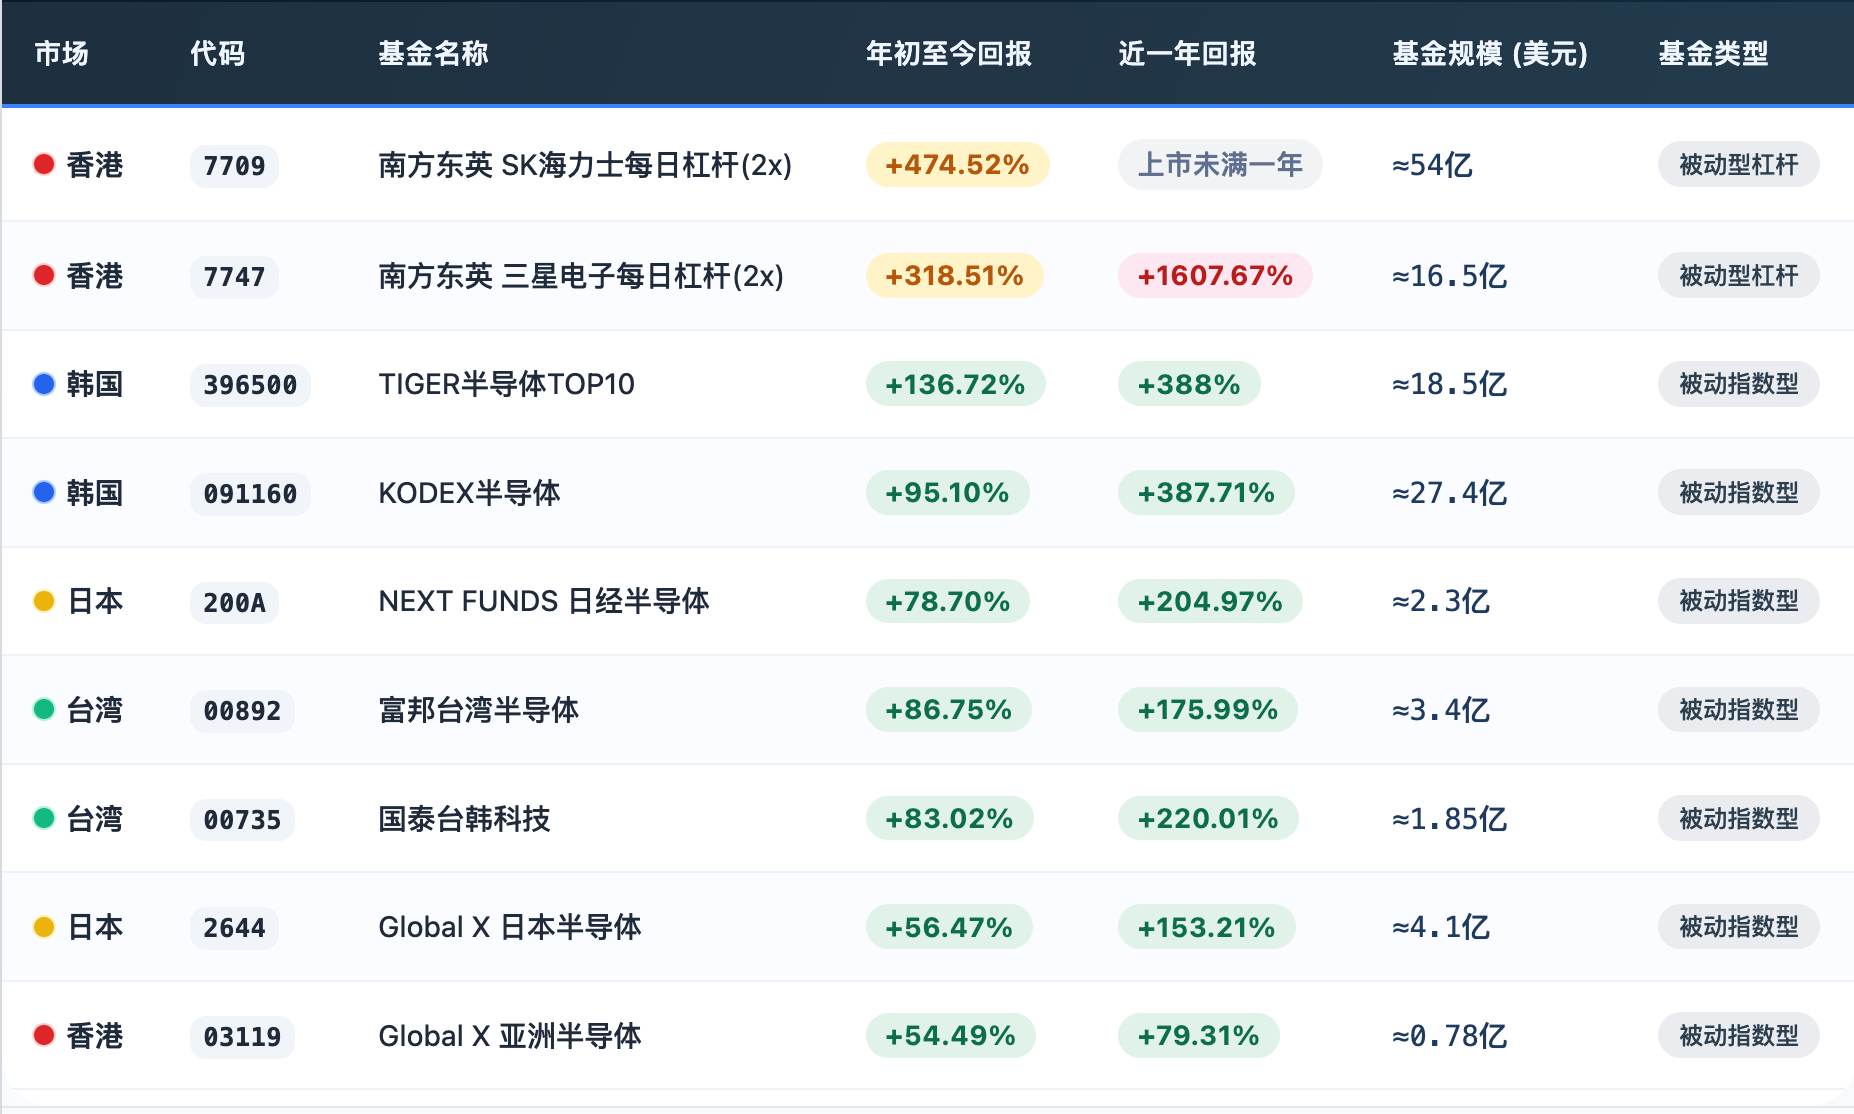
Comparison of Key Metrics for Asia-Pacific Memory Chip ETFs
The following table lists products by listing market, with metrics updated as of May 10:
South Korean Market: The Main Battlefield for Memory Purity
The Korea Exchange offers products with the highest memory purity in the Asia-Pacific region. The TIGER Semiconductor TOP10 ETF (396500) focuses its investments on South Korea's top ten semiconductor companies, with SK Hynix accounting for approximately 29.63% and Samsung Electronics for about 25.39%, totaling roughly 55%. Total assets under management (AUM) stand at approximately 12 trillion KRW. Driven by the surge in AI memory demand, its total return including dividends over the past year has reached as high as approximately 388%.
The KODEX Semiconductor ETF also holds heavy positions in South Korean semiconductor firms, with Samsung Electronics and SK Hynix accounting for a combined total of about 53%. Its size is approximately 3.5 trillion KRW, with a one-year return of about 301%.
The core advantage of South Korean memory ETFs lies in terminal pricing power; SK Hynix holds about 52% of the HBM market share while Samsung holds approximately 48%, meaning global memory chip prices are dominated by these two South Korean giants. This represents the most direct transmission mechanism between memory purity and performance elasticity.
Notably, the South Korean market has recently seen a flurry of listings for Covered Call memory ETFs, attracting retail capital with a strategy of "regular dividends + memory elasticity." The KODEX Semiconductor Target Weekly Covered Call ETF, which launched on May 12, systematically sells weekly KOSPI 200 call options against 30% of its holdings, targeting an annualized distribution of approximately 9%.
Furthermore, South Korea's first batch of single-stock leveraged ETFs will be listed on May 27, targeting Samsung Electronics and SK Hynix as underlying assets with a maximum leverage ratio of 2x.
Japanese Market: The "Pick-and-Shovel" Logic Amid Zero Memory Purity
The strengths of Japanese semiconductor ETFs are concentrated in upstream equipment and materials. The Global X Japan Semiconductor ETF (2644) has its top five holdings accounting for over 49% in total: Advantest (10.69%), Lasertec (10.46%), Disco (10.04%), Tokyo Electron (9.14%), and Renesas Electronics (8.79%). It has a fund size of approximately 63.4 billion JPY, a year-to-date return of about 56.41%, and an expense ratio of 0.649%.
The NEXT FUNDS Nikkei Semiconductor ETF (200A) has a similar holding structure with an expense ratio of only 0.165%. Neither holds Samsung Electronics or SK Hynix; their returns are derived entirely from global capacity expansion orders.
A unique variable for Japanese ETFs is the exchange rate. Approximately 42% of Tokyo Electron's revenue comes from China and 17% from South Korea; for every 1% appreciation or depreciation of the Yen, overseas profits fluctuate directly when translated back into Yen. For non-Yen investors, exchange rates may overlay significant gains or losses on top of the returns from the underlying assets.
Taiwan Market: The Sole Channel for the Taiwan-Korea Dual Engines
The Cathay Taiwan-Korea Tech ETF (00735) is currently the only product in Taiwan that simultaneously holds TSMC and the two South Korean memory giants. Its top three components are Samsung Electronics (approx. 23%), TSMC (approx. 19%), and SK Hynix (approx. 13%), together accounting for nearly 60% of the fund. With a size of approximately 10.5 billion TWD, the fund is currently trading at a discount and has delivered a one-year total return including dividends of about 220%.
The Fubon Taiwan Semiconductor ETF (00892) focuses entirely on Taiwan's local advanced processes and IC design, excluding Samsung Electronics and SK Hynix, with a one-year return of approximately 175.99%. The difference between the two reflects the core driving force of the current market trend: memory pricing power resides in South Korea, while advanced process pricing power resides in Taiwan.
Hong Kong Market: A Hub for Cross-Regional Coverage and Leveraged Tools
For investors unable to directly open trading accounts in South Korea or Taiwan, Hong Kong offers the most extensive alternative options. In terms of cross-regional ETFs, the Global X Asia Semiconductor ETF (03119) covers holdings such as TSMC, Samsung Electronics, and SK Hynix, with an AUM of approximately 608 million HKD.
Regarding leveraged ETFs, the CSOP SK Hynix Daily (2x) Leveraged Product (7709) and the CSOP Samsung Electronics Daily (2x) Leveraged Product (7747) provide twice the daily return of the underlying stocks. As of mid-May 2026, the SK Hynix leveraged ETF has an AUM of approximately 5.4 billion USD, making it the world's largest single-stock leveraged product; the Samsung Electronics leveraged ETF is approximately 1.65 billion USD.
What Drives the Dispersion in ETF Returns? The Combined Effect of Price Appreciation, Exchange Rates, and Premiums
The book returns of Asia-Pacific memory ETFs can be broken down into three tiers, with the allocation across these layers varying significantly among different products.
The first is the appreciation of underlying assets; the higher the "memory purity" of the ETF, the larger the contribution of this tier. Approximately 96% of the returns for TIGER Semiconductor TOP 10 (396500) are driven by memory chip stock prices, primarily because its heavy positions in Samsung Electronics and SK Hynix together account for about 55% of the portfolio.
Approximately 60% of the returns for Cathay Taiwan-Korea Tech (00735) stem from integrated Taiwan-Korea market dynamics, likewise due to its heavy weightings in leaders such as TSMC, Samsung, and SK Hynix, which collectively represent nearly 60% of its holdings.
Global X Japan Semiconductor (2644) focuses on semiconductor equipment, with its top five holdings totaling over 49%. Its returns depend on the order momentum for equipment driven by global fab expansions, rather than memory chips.
The second factor is exchange rate fluctuations. The NAV of Cathay Taiwan-Korea Tech (00735) is denominated in TWD, while the underlying assets are traded in KRW. In April, the KRW surged 3.29% and the TWD appreciated 1.05%; the KRW's additional appreciation relative to the TWD directly amplified returns. Goldman Sachs recently warned that under the AI wave, the current account surpluses of South Korea and Taiwan have hit record highs, putting appreciation pressure on both the KRW and TWD. For cross-border ETF investors, currency is both a return amplifier and a risk amplifier.
Finally, there is premium volatility. The premium on Hong Kong-listed ETFs is an implicit cost at the time of purchase. Although it has currently receded to 1%-1.3%, historical data shows that premiums can rapidly converge from over 12%, and the erosion during sentiment reversals cannot be ignored. Taiwan-listed 00735 is currently trading at a discount and does not carry this risk.
What are the core risks of investing in storage ETFs?
The duration of the memory cycle is the most critical variable. New capacity from Samsung and SK Hynix is expected to be fully operational between late 2027 and 2028. Markets typically price in capacity releases 12 to 18 months in advance, meaning expectations of supply expansion are most likely to enter the pricing window in the second half of 2026.
In terms of investment concentration, the combined weight of the top three holdings in pure-play memory ETFs ranges from 50% to 73%. Higher concentration results in greater elasticity, but also deeper drawdowns during market downturns.
Furthermore, exchange rate risk primarily affects cross-border products in Japan and Taiwan. If the Bank of Japan’s June rate hike materializes and the Yen appreciates, the net asset values of 2644 and 200A will come under direct pressure. Meanwhile, Taiwanese products denominated in New Taiwan Dollars with underlying assets traded in Korean Won will bear the dual impact of KRW exchange rate volatility.
How should investors choose the storage ETF that is right for them?
From selection to holding, you can evaluate based on the following path: first choose the industry chain position, then examine the source composition of every dollar, and finally decide whether to replace pure beta with covered calls.
First, choose the market: South Korea offers the greatest elasticity for memory terminals, Taiwan provides a balanced dual-engine solution for Taiwan and Korea, Japan offers the most certain equipment demand during the expansion cycle, and Hong Kong serves as a convenient cross-regional channel.
In terms of returns, comprehensively considering the actual appreciation of underlying assets, the contribution or drag of exchange rates, and the premium levels paid at purchase will lead to a more accurate understanding of portfolio performance.
Strategy is essentially about deciding what to exchange for what. Pure beta captures trends, while covered calls lock in distributions; the two differ significantly in bull markets but tend to converge in volatile markets.
AI data center investment is still in an explosive phase, and memory chips are the segment with the most significant supply-demand gap in the industry chain. ETFs with different purity levels, currency exposures, and strategies ultimately correspond to starkly different risk-reward profiles.
This content was translated using AI and reviewed for clarity. It is for informational purposes only.
Recommended Articles


Comments (0)
Click the $ button, enter the symbol, and select to link a stock, ETF, or other ticker.