

Japanese Stocks: Strategic Differences Between Short-Term and Long-Term Approaches

Executive Summary
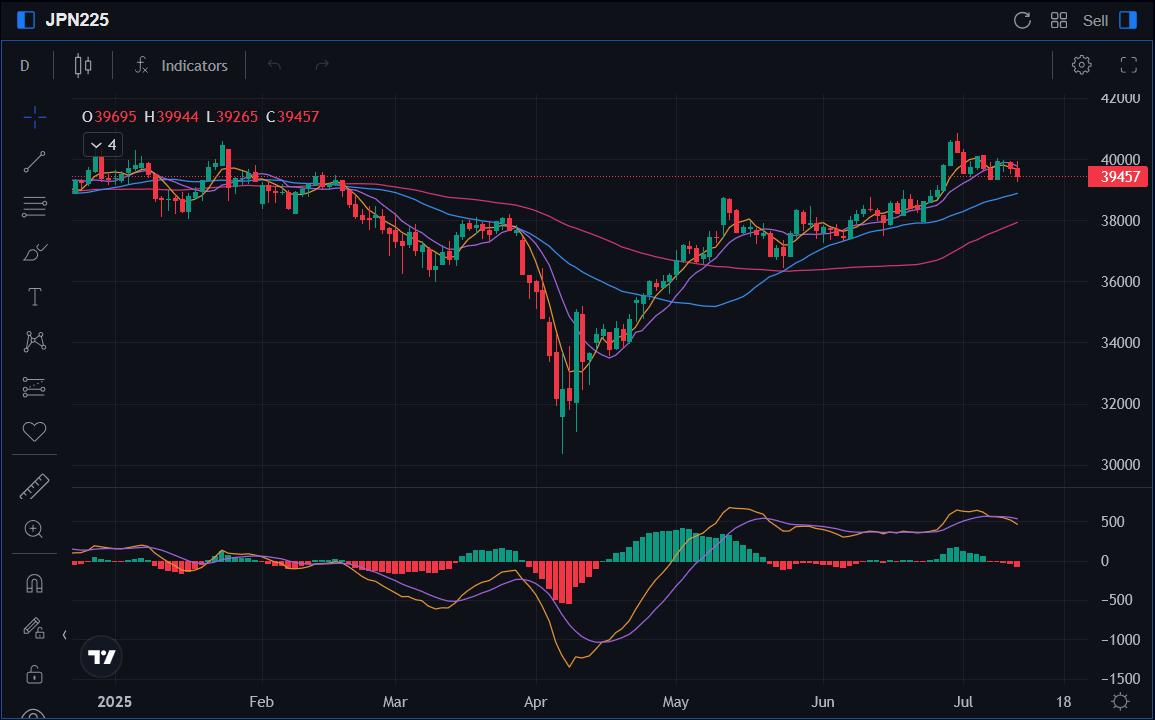
TradingKey - Following significant gains in 2023 and 2024, we anticipate that the Japanese stock market will enter a period of volatility and consolidation. This outlook stems from two opposing forces. On the positive side, Japan's improving economic fundamentals are driving wage growth and consumer spending, which in turn bolster corporate earnings. On the negative side, the sustained appreciation of the yen poses challenges. As an export-driven economy, Japan relies heavily on industries such as automotive, electronics, and machinery, with major listed companies like Toyota, Honda, Sony, and Panasonic depending on international markets. A stronger yen undermines these firms' global competitiveness and profitability. The interplay of these counteracting forces suggests that Japanese stocks are unlikely to exhibit a clear upward or downward trend in the near term. Therefore, in terms of strategy, short-term traders should closely monitor the current range-bound fluctuations, focusing on the Nikkei 225 Index’s support level at 33,600 and resistance level at 41,200. A rebound may occur when the index approaches the lower bound, while a pullback could emerge near the upper bound. Traders can capitalise on these opportunities using financial instruments such as Nikkei 225 ETFs, futures, options, contracts for difference (CFDs), or spread betting, employing a strategy of entering at lower levels and exiting at higher levels. However, long-term investors should remain cautious and temporarily avoid Japanese equities at this stage.
Source: Mitrade
* Investors can directly or indirectly invest in the stock market through passive funds (such as ETFs), active funds, financial derivatives (like futures, options and swaps), CFDs and spread betting.
1. Recent Stock Trends
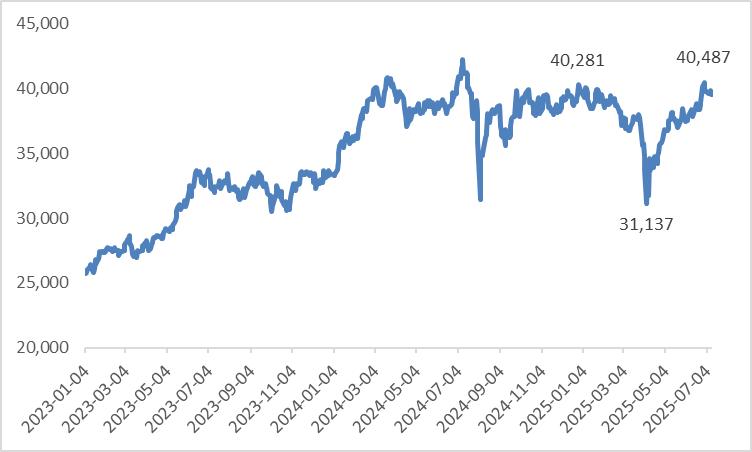
Driven by Japan’s economic recovery, improved corporate earnings, and significant stock market reforms, the Japanese stock market experienced substantial gains in 2023 and 2024. However, entering 2025, the one-sided upward trend has stalled. The Nikkei 225 index has exhibited volatility, initially declining before recovering, influenced by a combination of factors including changes in U.S. tariff policies, shifting market sentiment, corporate stock buybacks, and capital inflows (Figure 1).
Figure 1: Nikkei 225 Since 2023
Source: Refinitiv, TradingKey
* For related information, refer to the article published on 9 July 2025, titled “20-Year JGB Auction Back in Focus as the Japan Bond Market Faces Political Risk”
2. Positive Factors Supporting Japanese Stocks
Looking forward, we anticipate that Japanese stocks will maintain their current pattern of volatility, lacking a definitive upward or downward trajectory, due to the balancing effect of opposing positive and negative forces. A primary positive driver for Japanese stocks is the strengthening of Japan’s economic fundamentals.
Despite Japan currently facing high inflation and negative real GDP growth in the first quarter, government actions, such as the ongoing release of emergency rice reserves, are expected to ease inflationary pressures. Concurrently, steady wage increases are likely to enhance household real income. This rise in income will support higher aggregate demand, driving the restocking cycle. Through this positive demand-inventory cycle, Japan’s economy is projected to return to positive growth in the second quarter.
A positive economic outlook is expected to provide an upward impetus for Japanese stocks through enhanced corporate earnings and bolstered investor confidence. First, an improving economic environment typically drives wage growth, which fuels private sector consumption and domestic demand, creating a virtuous cycle of economic growth that supports higher corporate profits. Coupled with ongoing corporate governance reforms, this is likely to improve return on equity (ROE), further driving stock price appreciation. Second, consistently positive economic data will strengthen investor confidence in Japan’s financial markets and real economy. For instance, Warren Buffett has publicly stated that even if the Bank of Japan raises interest rates, he would not consider selling Japanese stocks. Moreover, growing confidence is expected to attract overseas investors to increase their holdings of yen-denominated assets, with foreign capital inflows further propelling Japanese stock market gains.
3. Negative Factors Impacting Japanese Stocks
A key negative factor for Japanese stocks is the sustained strengthening of the yen. The yen’s appreciation is primarily driven by two core factors: first, the divergence in monetary policies between the U.S. and Japan, with the Federal Reserve restarting rate cuts while the Bank of Japan raises them, supporting the yen’s value against the dollar; second, Japan’s bond yields are expected to remain relatively high, further reinforcing the yen’s upward trajectory.
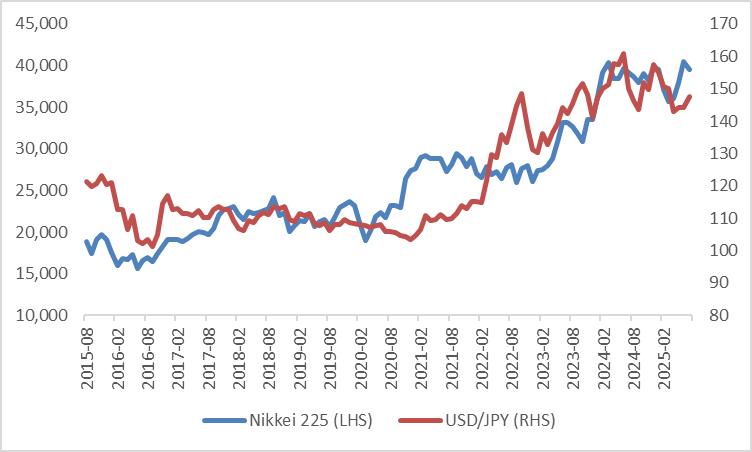
The appreciation of the yen impacts the Japanese stock market primarily through two channels (Figure 3). First, Japan’s economy is heavily export-oriented, with key industries such as automotive, electronics, and machinery, as well as major listed companies like Toyota, Honda, Sony, and Panasonic, relying significantly on overseas markets. A stronger yen directly undermines these companies’ international competitiveness and profitability. Second, as Japanese companies report their financials in yen, the conversion of foreign currency revenues (e.g., U.S. dollars) into yen results in lower reported revenue and profits due to exchange rate fluctuations. This reduction in earnings directly pressures stock valuations from the numerator of valuation models.
Figure 3: Japanese Stocks and Yen
Source: Refinitiv, TradingKey
4. Investment Strategies
Given the current interplay of positive and negative factors impacting the Japanese stock market, coupled with the phased characteristics of the macroeconomy, investment strategies should be built on the dynamic monitoring of core variables. Short-term trading strategies should focus closely on the tug-of-war between bullish and bearish forces and key macroeconomic data points. The central conflict in the short-term market lies in the tension between "economic recovery momentum" and "yen appreciation pressure," requiring precise operations guided by macroeconomic data and policy signals.
· Range-Bound Trading Framework: Maintain focus on the Nikkei 225 index within the 33,600–41,200 range, integrating trigger conditions tied to key variables. When the index nears the 33,600 support level and positive factors prevail (e.g., Japan’s core CPI falls below 3% year-on-year or monthly cash wage growth exceeds 3.5%, indicating easing inflation and stronger domestic demand), investors can position for a rebound using Nikkei 225 ETFs or futures, targeting the upper range limit. Conversely, if the index approaches the 41,200 resistance level and negative factors intensify (e.g., USD/JPY drops below 140 or the US-Japan 10-year yield spread narrows to within 200 basis points), investors can secure profits through short futures or put options.
· Sector Rotation Strategy: Given the divergence between positive factors like "domestic demand expansion" and negative factors like "export pressures," focus on two types of assets in the short term. First, prioritize sectors that benefit from wage growth and domestic demand recovery, such as retail (e.g., Seven & I Holdings) and food processing (e.g., Ajinomoto). These sectors are less sensitive to yen appreciation and directly capitalize on the "demand-inventory cycle." Second, avoid export-reliant sectors like automotive (e.g., Toyota, Honda) and consumer electronics (e.g., Sony), particularly due to potential profit impacts from "foreign exchange losses" in their quarterly earnings.
* For further details supporting our foreign exchange market views, please refer to the macroeconomic section below.
5. Macroeconomics
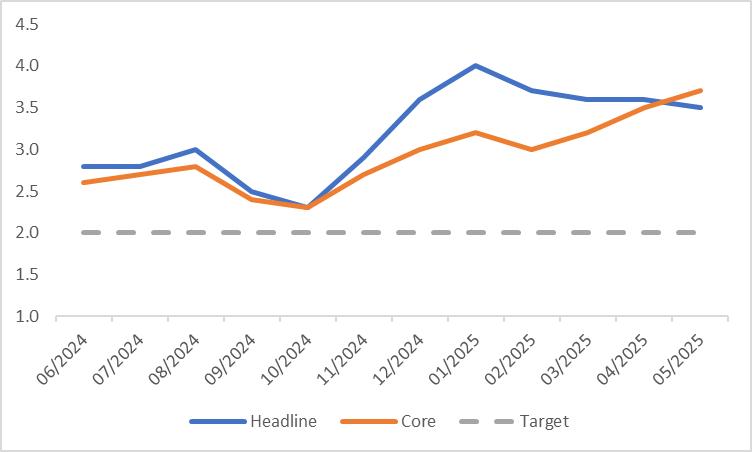
Currently, high inflation poses a significant challenge to Japan’s economy. While the headline Consumer Price Index (CPI) has declined from 4% earlier this year, the latest May data still stands at 3.5%, well above the Bank of Japan’s 2% target. Soaring rice prices are a primary driver of inflation, having more than doubled compared to last year despite government measures such as releasing emergency rice reserves and reforming distribution systems. Additionally, core CPI, which excludes energy and food, has been steadily rising since February (Figure 5.1). This upward trend is largely attributed to wage growth fuelling increases in core service prices.
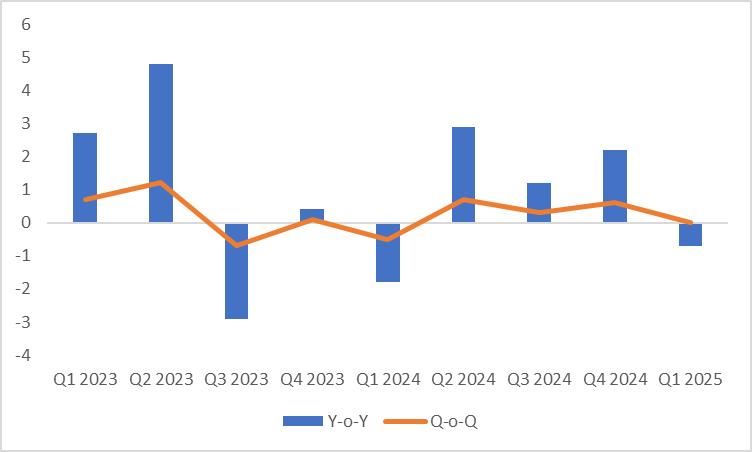
Japan’s economic growth has been noticeably impacted by high inflation. Despite some income growth in the private sector, consumer spending has declined by 0.5% due to concerns over persistent price increases and uncertainty about the future. Concurrently, weakening global demand and heightened trade tensions have led to a recent decline in Japan’s exports. Combined with slower manufacturing growth and reduced investment, these factors contributed to a year-on-year contraction in real GDP during the first quarter (Figure 5.2). Nevertheless, we remain optimistic about Japan’s macroeconomic outlook. Ongoing government measures, such as the release of emergency rice reserves, are expected to ease inflationary pressures, while steady wage growth is likely to boost household real income. This increase in income will support rising aggregate demand, facilitating the restocking cycle. Through this positive demand-inventory cycle, Japan’s economy is projected to return to positive growth in the second quarter.
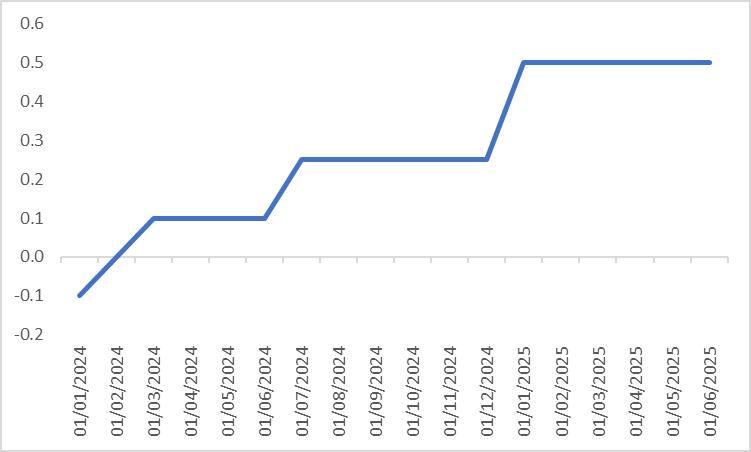
Since the Bank of Japan (BOJ) ended its negative interest rate policy in March 2024, it has implemented a cumulative interest rate hike of 60 basis points (Figure 5.3). On 17 June 2025, the BOJ decided to maintain its policy rate at 0.5% while announcing a reduction in the pace of its balance sheet contraction from 400 billion yen per quarter to 200 billion yen per quarter starting in April 2026. Although this move may appear dovish at first glance, we believe this policy stance is unlikely to persist. Given that current inflation remains above the target and the economic outlook is relatively positive, we anticipate the BOJ will adopt a more hawkish approach, resuming interest rate hikes in the third or fourth quarter of 2025.
Figure 5.1: Japan CPI (%, y-o-y)
Source: Refinitiv, TradingKey
Figure 5.2: Japan Real GDP (%)
Source: Refinitiv, TradingKey
Figure 5.3: BoJ Policy Rate (%)
Source: Refinitiv, TradingKey

Recommended Articles


Comments (0)
Click the $ button, enter the symbol, and select to link a stock, ETF, or other ticker.