

NZD/JPY Price Analysis: Cross continues consolidating, still above 97.00


- NZD/JPY remains stable at 97.60, as the pair starts consolidating.
- The 20-day SMA at 96.30 offers considerable support against a potential correction.
- Despite the consolidation phase, the bullish outlook persists, eyeing the next key resistance at 98.00.
On Tuesday, the NZD/JPY cross appeared to have entered a consolidation phase, retaining its footing at the fresh high of 97.80. Flaunting its resilience, the pair maintained its strong support at the 20-day Simple Moving Average (SMA) of 96.30, while hovering at high levels not witnessed since July 2007. The bullish outlook remains undisputed, despite the necessity for a healthy correction to address the overbought conditions.
The daily Relative Strength Index (RSI) currently stands at 66, a decline from Monday's 68, hinting at an impending downtrend. However, it remains within a positive territory devoid of extreme conditions. Meanwhile, the Moving Average Convergence Divergence (MACD) prints flat red bars which implies diminishing buying pressure as a shift towards a potential consolidation or correction phase.
NZD/JPY daily chart
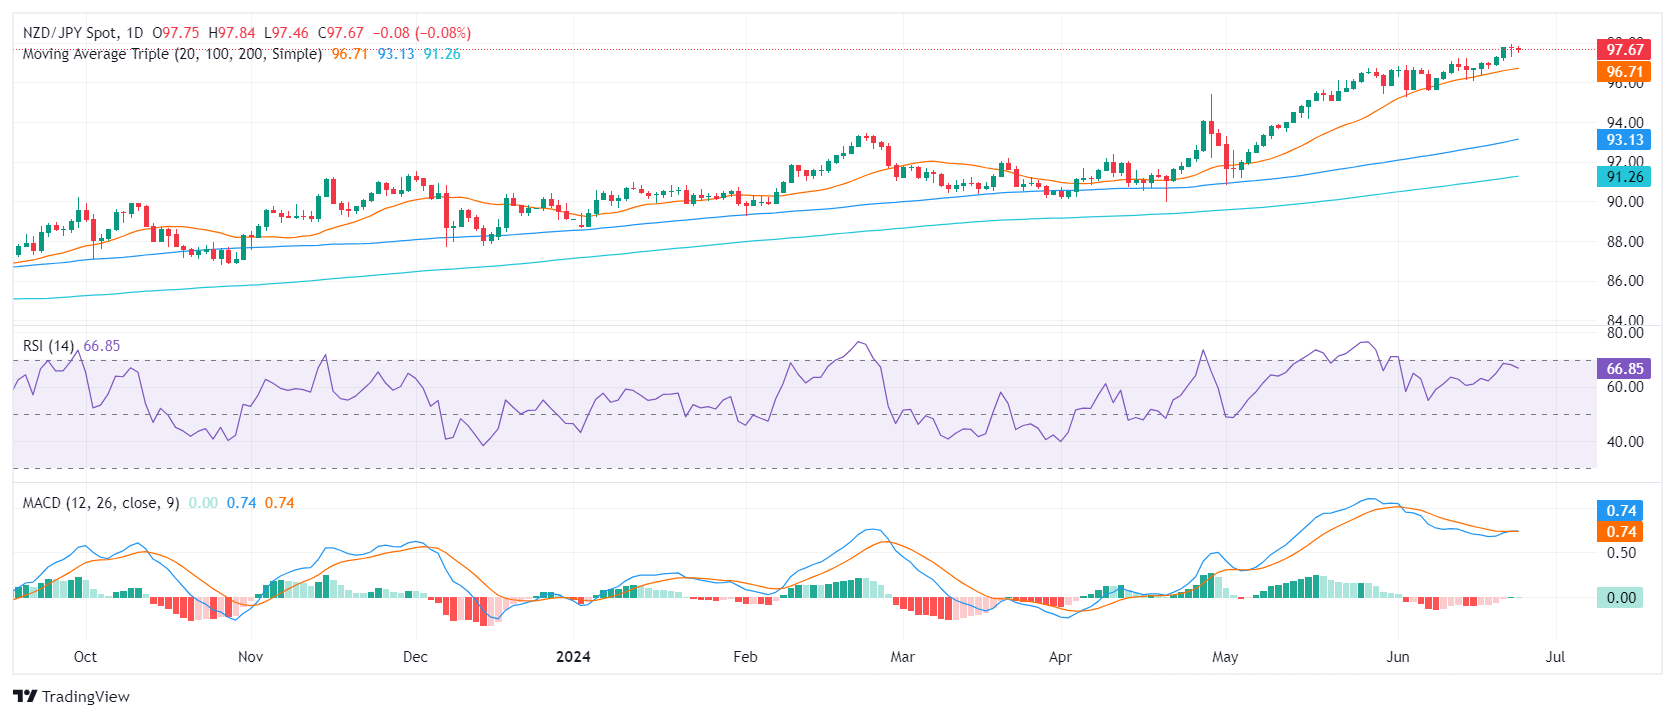
The steady grip of bulls above the 20-day SMA illustrates their strength, coupled with the technical indicators nearing overbought status, this further cements the positive technical outlook of the Kiwi against the Yen. However, overbought conditions necessitate a healthy correction or consolidation to ensure sustained upward momentum.
As investors anticipate subsequent trading sessions, the focus is on the immediate support at 97.00 and the resistance target at 98.00. A sustained break above the consolidation range could validate further upside while slipping below the 20-day SMA could indicate a deeper correction.
NZD/JPY
Overview | |
|---|---|
Today last price | 97.64 |
Today Daily Change | -0.11 |
Today Daily Change % | -0.11 |
Today daily open | 97.75 |
Trends | |
|---|---|
Daily SMA20 | 96.65 |
Daily SMA50 | 94.72 |
Daily SMA100 | 93.06 |
Daily SMA200 | 91.22 |
Levels | |
|---|---|
Previous Daily High | 97.92 |
Previous Daily Low | 97.28 |
Previous Weekly High | 97.8 |
Previous Weekly Low | 96.09 |
Previous Monthly High | 96.74 |
Previous Monthly Low | 90.83 |
Daily Fibonacci 38.2% | 97.53 |
Daily Fibonacci 61.8% | 97.68 |
Daily Pivot Point S1 | 97.38 |
Daily Pivot Point S2 | 97.01 |
Daily Pivot Point S3 | 96.74 |
Daily Pivot Point R1 | 98.02 |
Daily Pivot Point R2 | 98.29 |
Daily Pivot Point R3 | 98.66 |
Recommended Articles


Comments (0)
Click the $ button, enter the symbol, and select to link a stock, ETF, or other ticker.