

GBP/JPY hits another 16-year high as markets dare BoJ to intervene


- GBP/JPY chalks in a fresh multi-year high of 202.73 on Tuesday.
- Guppy on pace for a sixth straight month of gains.
- FX markets continue to sell off the Yen broadly.
GBP/JPY continues its march higher as the Japanese Yen slumps across the board. Buried beneath irreversible market flows, the Bank of Japan (BoJ) remains stubbornly planted in a hyper-easy monetary policy stance. Attempts to verbally talk the Yen back up, up to and including veiled threats of direct market intervention, have done little to stem the tide of short pressure built up in JPY markets.
A quiet early—to mid-week economic calendar leaves the Guppy churning on thin market flows. The back half of the trading week promises a more impactful schedule, with Japanese inflation and UK Gross Domestic Product (GDP) figures on the agenda.
Japanese Large Retail Sales will kick off the Guppy’s late-week release schedule early Thursday. Japanese Retail Trade is expected to print a slight decline to 2.0% from 2.4% for the year ended in May. The Bank of England’s (BoE) latest Financial Stability Report will also be released on Thursday.
Friday will round out the week with Japan’s latest Tokyo Consumer Price Index (CPI) inflation, followed by the UK’s first-quarter GDP revision which is expected to hold steady at 0.6%.
GBP/JPY technical outlook
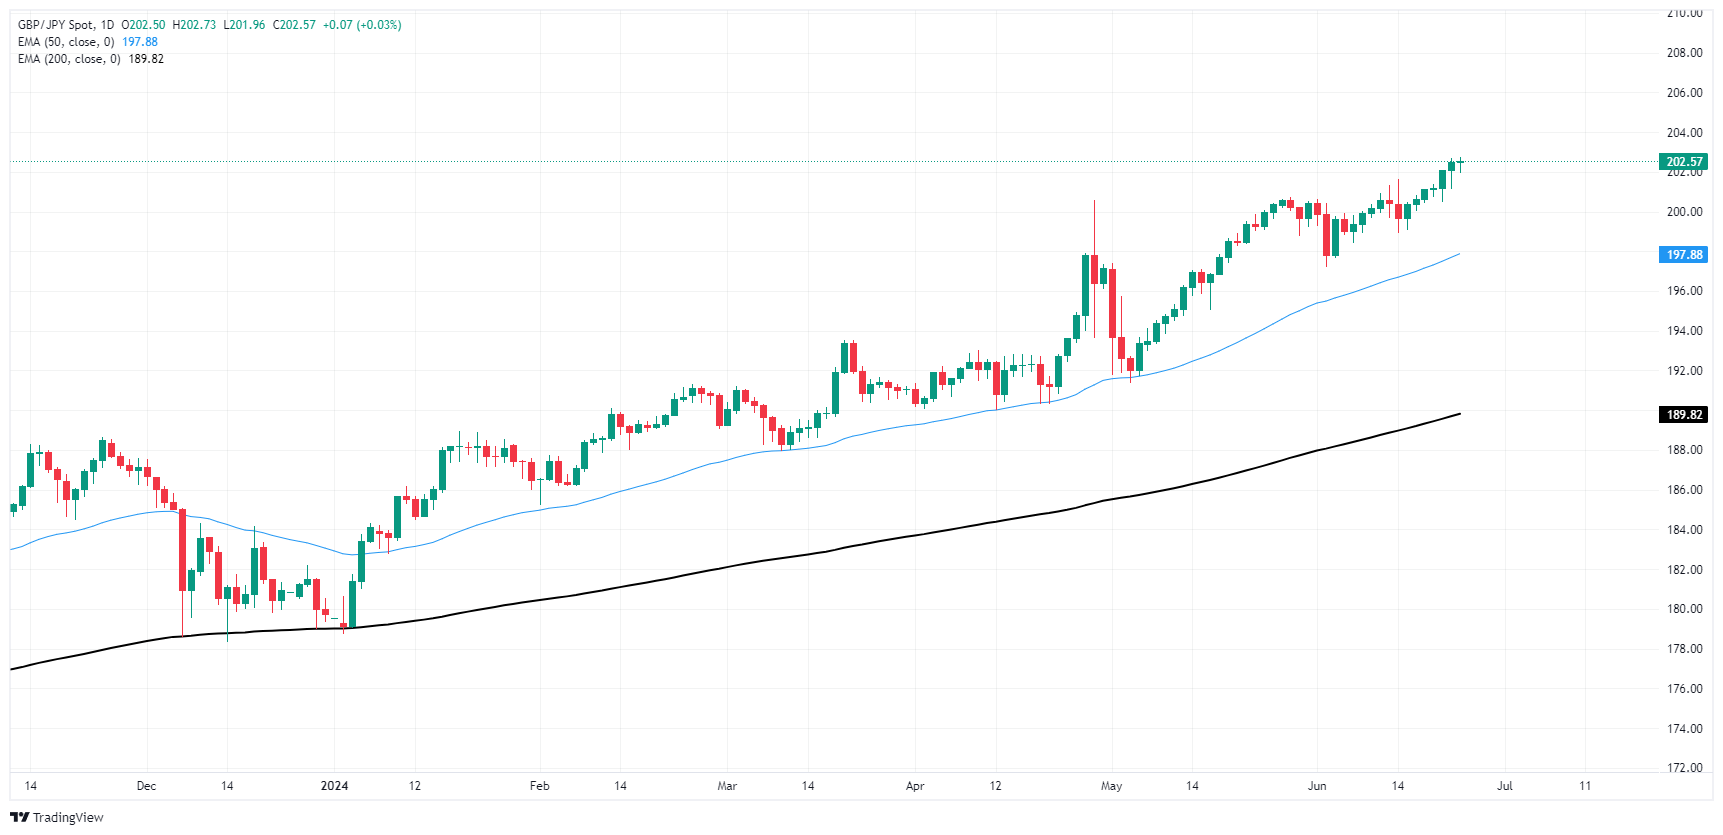
The Guppy ticked into a fresh 16-year high on Tuesday, clipping 202.73. The pair is on pace to close flat or higher for the seventh consecutive trading day, and GBP/JPY has risen over 6% from mid-May.
GBP/JPY has traded well north of the 200-day Exponential Moving Average (EMA) at 198.86, rising nearly 13.5% bottom-to-top in 2024. The Guppy has closed flat or in the green for all but six of the last 25 consecutive trading weeks, and markets will be on the lookout for any signs of structural intervention from the BoJ as GBP/JPY continues the march to 204.00.
GBP/JPY daily chart
GBP/JPY
Overview | |
|---|---|
Today last price | 202.58 |
Today Daily Change | 0.08 |
Today Daily Change % | 0.04 |
Today daily open | 202.5 |
Trends | |
|---|---|
Daily SMA20 | 200.27 |
Daily SMA50 | 197.34 |
Daily SMA100 | 193.82 |
Daily SMA200 | 188.88 |
Levels | |
|---|---|
Previous Daily High | 202.7 |
Previous Daily Low | 201.14 |
Previous Weekly High | 202.09 |
Previous Weekly Low | 199.06 |
Previous Monthly High | 200.75 |
Previous Monthly Low | 191.37 |
Daily Fibonacci 38.2% | 202.11 |
Daily Fibonacci 61.8% | 201.74 |
Daily Pivot Point S1 | 201.52 |
Daily Pivot Point S2 | 200.55 |
Daily Pivot Point S3 | 199.95 |
Daily Pivot Point R1 | 203.09 |
Daily Pivot Point R2 | 203.68 |
Daily Pivot Point R3 | 204.66 |
Recommended Articles


Comments (0)
Click the $ button, enter the symbol, and select to link a stock, ETF, or other ticker.