

USD/JPY Price Analysis: Steadies as Asian session begins, above 158.00


- USD/JPY remains above Ichimoku Cloud, Tenkan, and Kijun-Sen levels, supporting further upside potential.
- Key resistance levels: 158.25 (June 17 high), 158.44 (April 26 peak), and 160.32 (YTD high).
- Support levels: 157.00, Tenkan-Sen at 156.98, Senkou Span A at 156.16, and Kijun-Sen at 155.93.
The USD/JPY remains flat as Thursday’s Asian session begins, yet it printed minuscule gains of 0.15% on Wednesday. The lack of catalysts and US traders away from their desks in observance of the Juneteenth holiday dried up the FX space, which has remained unmoved since the London close. The major trades at 158.00, virtually unchanged.
USD/JPY Price Analysis: Technical outlook
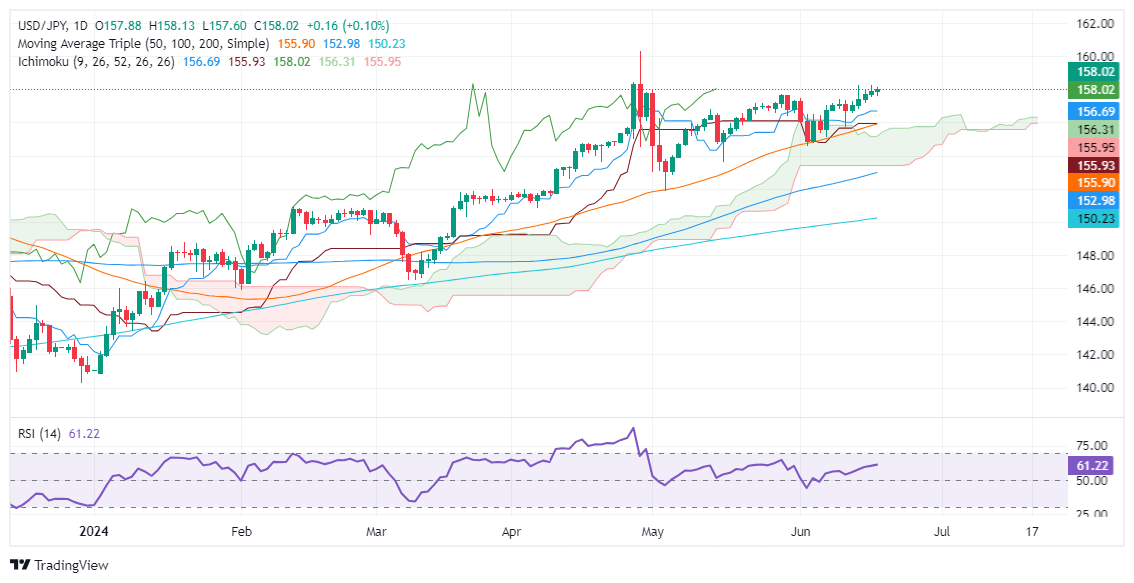
The pair’s uptrend remains intact, with the spot price remaining above the Ichimoku Cloud (Kumo) and on top of the Tenkan and Kijun-Sen levels. Those reasons justify further USD/JPY upside, but fears that Japanese authorities might intervene in the markets keep traders cautious, with the major advancing steadily.
The Relative Strength Index (RSI) remains bullish, supporting buyers.
The first key resistance level they need to clear is the June 17 high of 158.25. Once surpassed, the next stop would be the April 26 peak at 158.44 ahead of the year-to-date (YTD) high of 160.32 would be next.
Conversely, sellers can challenge key support levels if USD/JPY drops below 157.00. The first would be the Tenkan-Sen at 156.98, followed by Senkou Span A at 156.16. Once cleared, the next stop would be the Kijun-Sen at 155.93. The next demand area would be the Senkou Span B at 155.52.
USD/JPY Price Action – Daily Chart
USD/JPY
Overview | |
|---|---|
Today last price | 158.01 |
Today Daily Change | 0.14 |
Today Daily Change % | 0.09 |
Today daily open | 157.87 |
Trends | |
|---|---|
Daily SMA20 | 156.84 |
Daily SMA50 | 155.8 |
Daily SMA100 | 152.87 |
Daily SMA200 | 150.18 |
Levels | |
|---|---|
Previous Daily High | 158.23 |
Previous Daily Low | 157.52 |
Previous Weekly High | 158.26 |
Previous Weekly Low | 155.72 |
Previous Monthly High | 157.99 |
Previous Monthly Low | 151.86 |
Daily Fibonacci 38.2% | 157.96 |
Daily Fibonacci 61.8% | 157.79 |
Daily Pivot Point S1 | 157.51 |
Daily Pivot Point S2 | 157.16 |
Daily Pivot Point S3 | 156.8 |
Daily Pivot Point R1 | 158.23 |
Daily Pivot Point R2 | 158.59 |
Daily Pivot Point R3 | 158.94 |
Recommended Articles


Comments (0)
Click the $ button, enter the symbol, and select to link a stock, ETF, or other ticker.