


Gold Price Forecast: Gold Plunges to Seven-Week Low, Can $4,100 Hold?



AI Podcast


Spot gold dropped 4% to $4,114.93 per ounce on Monday, pressured by rising energy prices that fueled inflation expectations, reinforcing Federal Reserve rate-hike bets, and boosting the U.S. dollar and Treasury yields. Technically, prices broke below the ascending trendline and key moving averages, signaling short-term bearish control. However, the RSI approaches oversold territory near 36.07, and strong support at the $4,100–$4,104 range suggests potential for a technical rebound if critical support holds. Conversely, a decisive break below $4,100 could target the $4,000 psychological mark.
TradingKey - Spot gold (XAUUSD) plunged 4% on Monday to close at $4,114.93 per ounce, hitting an intraday low of $4,110.80, its lowest level since August 5. Heading into Tuesday's Asian trading session, gold prices consolidated at low levels near $4,130, as market sentiment remained cautious.
Why Are Gold Prices Falling?
After U.S. President Trump rejected Iran's peace proposal, market expectations for the reopening of the Strait of Hormuz and the de-escalation of the Middle East conflict rapidly faded.
Under normal circumstances, heightened geopolitical risks tend to spur capital inflows into gold, but this market movement has followed a different transmission pathway. The reason is that risks related to the Strait of Hormuz first drove up energy prices, and persistently rising oil prices could further elevate overall inflation. For gold, this may instead bring fresh pressure, as the market begins to worry that the Federal Reserve will need to maintain a tighter monetary policy to combat inflation.
This has also formed a clear bearish pathway: rising oil prices push up inflation expectations, inflationary pressures reinforce rate-hike bets, and subsequently drive the U.S. dollar and Treasury yields higher. Although gold possesses inflation-hedging properties in the long run, the impact of rising interest rates tends to be far more direct in short-term trading.
However, significant variables remain in the Middle East situation. Iran continues to emphasize resolving the conflict through diplomatic means, and Trump has not completely closed the window for negotiations. If the two sides resume contact, the risk premium in oil prices could retreat, easing market concerns over inflation and rate hikes.
In addition to oil prices, gains in the U.S. dollar and U.S. Treasury yields have further amplified gold's decline.
On Monday, the U.S. Dollar Index hovered near a two-month high. Since international gold is priced in U.S. dollars, a stronger dollar means higher purchasing costs for non-U.S. dollar investors, which typically weighs on gold demand.
Meanwhile, U.S. Treasury yields continued to climb, with the 10-year Treasury yield rising to near its highest level since 2007 and the 2-year yield also moving noticeably higher, leading the market to further raise expectations that the Fed will continue tightening policy in the future.
For the gold market, rising yields mean capital faces a higher opportunity cost when holding gold. Gold itself yields no interest, so when interest-bearing assets like U.S. Treasuries offer higher yields, some capital naturally reassesses gold's allocation value.
Gold Price Technical Analysis
Source: TradingView
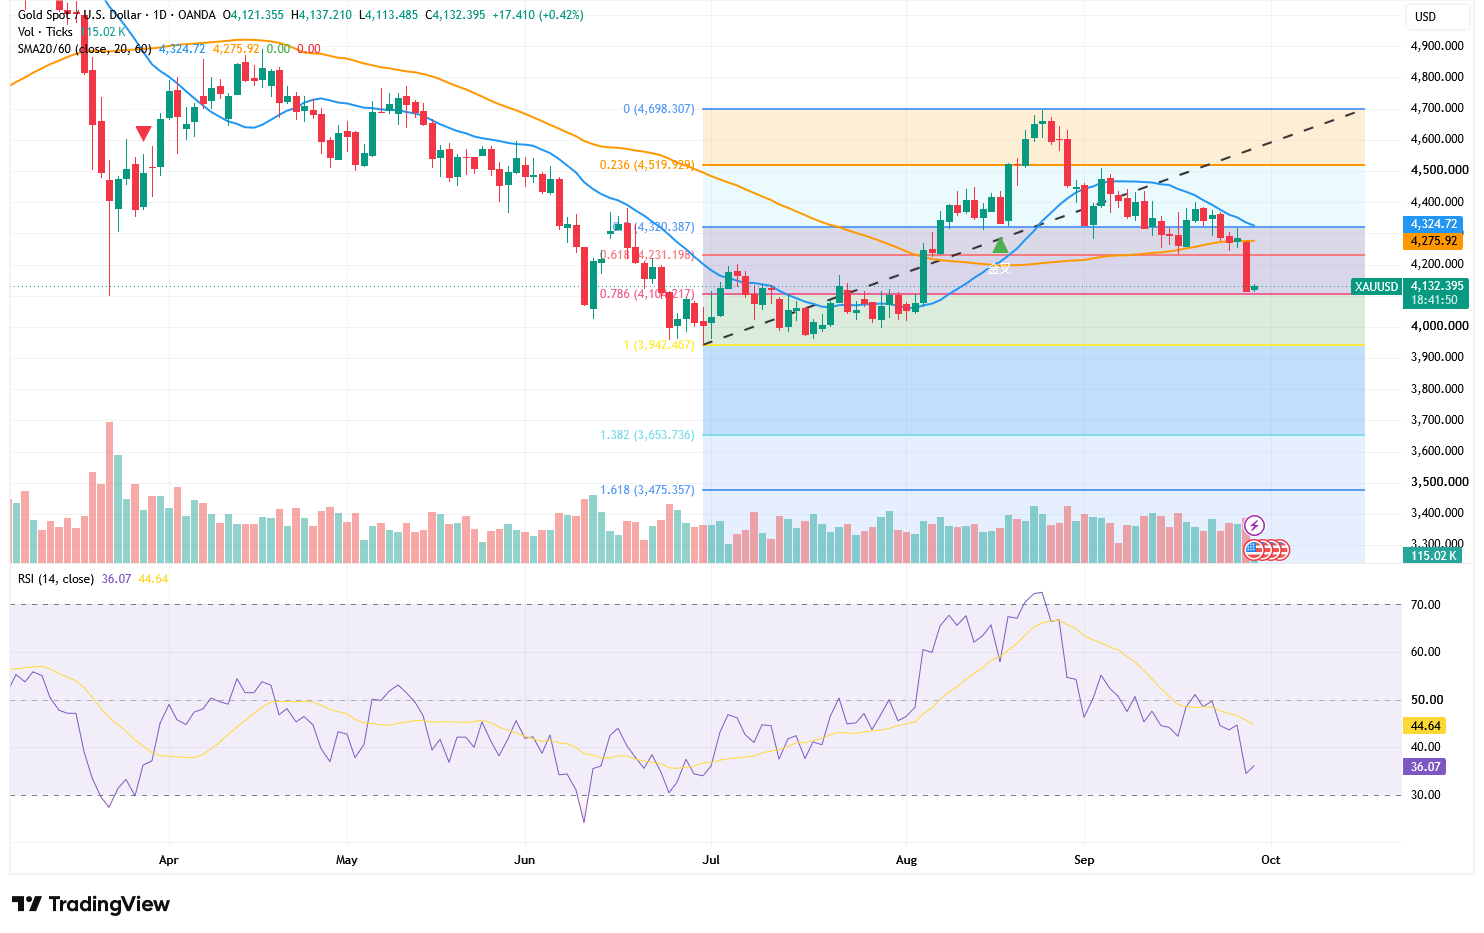
Judging from the daily chart, spot gold has weakened significantly after breaking below the ascending trendline, last trading near $4,132. It has lost both the 20-day moving average of $4,324.72 and the 60-day moving average of $4,275.92, indicating that bears remain in control in the short term. However, the 20-day moving average has not crossed below the 60-day moving average, meaning the medium-term trend has not fully turned bearish.
Currently, the most critical support lies between $4,100 and $4,104, with $4,104.22 corresponding to the 78.6% Fibonacci retracement level. Gold prices rebounded slightly after hitting an intraday low of $4,113, indicating buying interest is emerging near $4,100.
The RSI has dropped to 36.07, below its signal line at 44.64, reflecting that downside momentum remains strong. However, as the RSI gradually approaches the oversold zone of 30, the risk of chasing short positions is also rising.
If gold prices hold above $4,100 and reclaim $4,200–$4,231, a technical rebound could occur in the short term, with further resistance at the 60-day moving average of $4,276 and the $4,320–$4,325 range.
Conversely, if the daily close decisively breaks below $4,100, this round of correction could head further toward the psychological $4,000 mark, with focus subsequently on the previous low of $3,942.
This content was translated using AI and reviewed for clarity. It is for informational purposes only.
Recommended Articles











Comments (0)
Click the $ button, enter the symbol, and select to link a stock, ETF, or other ticker.