


Tesla Stock Forecast: Shares May Face New Drop as Q3 Delivery Estimates Cut, Trump Plans to Relax Fuel Economy Standards



AI Podcast


On September 28 ET, Tesla shares fell 3% as JPMorgan and Goldman Sachs lowered their Q3 2026 delivery forecasts due to weaker US and China performance, alongside policy risks from relaxed fuel efficiency standards. JPMorgan reduced its forecast to 482,000 vehicles and its price target to $415, while Goldman cut its estimate to 435,000. August new car registrations dropped approximately 13% in China and 4% in the US. Technically, the stock broke below all moving averages, testing the core pivot at $356.54. A decisive breach risks pushing the price toward $322.96, while reclaiming the $361.94–$369.88 moving average zone is required to revive bullish momentum.

TradingKey - On September 28 ET, Tesla (TSLA) shares fell 3%, with the company expected to announce its third-quarter 2026 delivery figures on October 2.
Investment banks JPMorgan and Goldman Sachs lowered their delivery forecasts, both citing weaker-than-expected performance in the US and China markets. In addition, the Trump administration's plan to relax fuel efficiency standards has added a policy variable to its automotive business.
Among them, JPMorgan cut its third-quarter delivery forecast from 516,000 to 482,000 vehicles, a decrease of about 6.5%, and lowered its price target from $445 to $415 while maintaining a "Neutral" rating. Goldman Sachs reduced its delivery forecast from 490,000 to 435,000 vehicles, while Barclays expects 475,000 vehicles.
Reportedly, the company's new car registrations in August dropped by nearly 13% in China and about 4% in the US.
On the other hand, policy changes could affect the longer-term competitive landscape. Trump stated he has approved new fuel economy standards, with the administration planning to issue final rules on Monday. If consistent with previous proposals, the requirement for 2031 model year vehicles will be lowered from about 50 miles per gallon to 34.5 mpg.
The connection between this policy and Tesla primarily lies in the competitive conditions for traditional gas-powered vehicles. Stringent fuel standards place greater pressure on automakers to improve fuel efficiency and adjust product lineups; relaxing these requirements could ease this pressure, making it easier for traditional automakers to continue selling gas-powered vehicles and weakening the policy push toward electric vehicles.
Furthermore, if reduced compliance pressure translates into lower costs or selling prices for gas-powered vehicles, the relative attractiveness of electric vehicles could be impacted. If Tesla needs to offer larger discounts to secure orders, volume competition could weigh on profit margins. Although the standards apply to future model years, the market may adjust its expectations for Tesla's future sales and profitability ahead of time, thereby weighing on its current valuation.
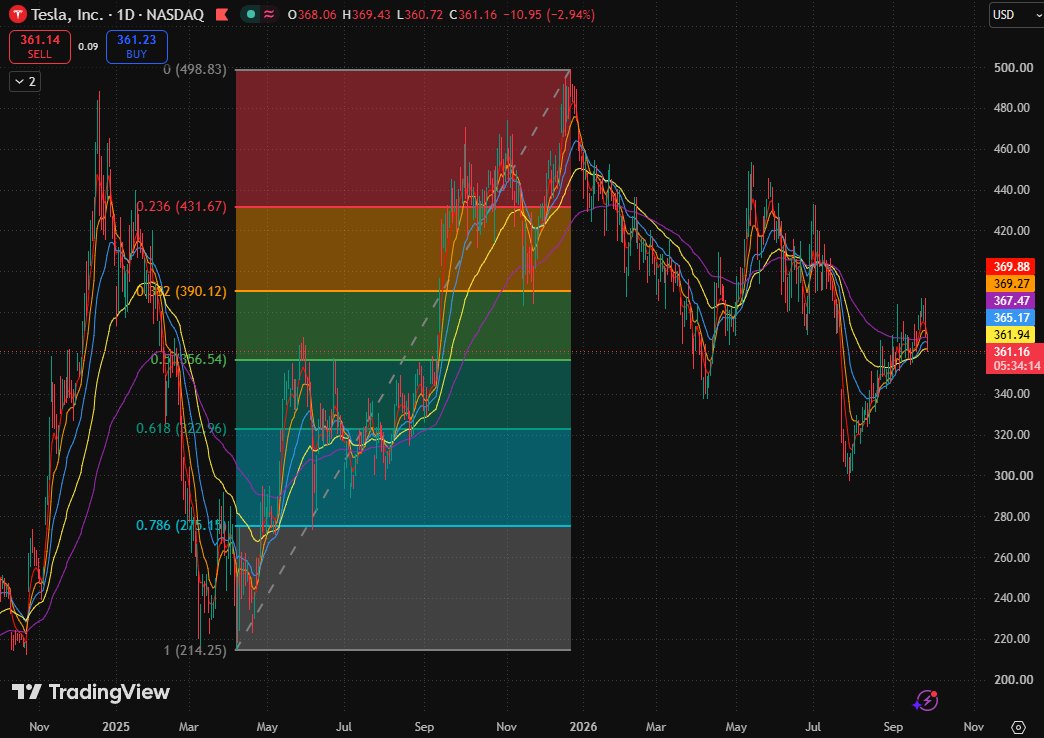
Tesla Daily Chart, Source: TradingView
After rebounding from around $300 to the $370 area, Tesla's stock price pulled back. It currently remains above the 0.5 Fibonacci retracement level ($356.54), but has fallen back below all indicated moving averages.
The current setup represents a blocked low-level bounce following a sharp decline rather than a medium-term trend reversal, with $356.54 serving as the core pivot currently being tested. However, as the current price has broken below all moving averages, short-term bounce momentum has visibly weakened.
Overhead selling pressure has regained dominance. A decisive break below $356.54 would turn the current low-level bounce into a new round of pullback, with the first target pointing to the 0.618 Fibonacci retracement level ($322.96). If that level fails to hold, caution is warranted regarding a potential move toward the 0.786 Fibonacci retracement level ($275.13).
On the upside, the main risk is that the stock price encounters resistance again upon rebounding into the moving average convergence zone between $361.94 and $369.88. Without reclaiming this region, any short-term rally resembles a weak bounce rather than a trend reversal signal. Only by reclaiming the 80-day moving average ($361.94) and recovering the 20-day moving average ($365.17) will the rebound have a chance to retest $390.12.
This content was translated using AI and reviewed for clarity. It is for informational purposes only.
Recommended Articles










Comments (0)
Click the $ button, enter the symbol, and select to link a stock, ETF, or other ticker.