


Gold Price Forecast: Gold Eyes Key $4,400 Resistance as Falling Oil Prices Ease Inflation Pressure



AI Podcast


As of the Asian session on September 21, gold prices consolidated near $4,360 following a rebound from $4,235. While hawkish Federal Reserve remarks cap upside potential, falling crude oil prices—driven by potential U.S.-Iran negotiations—have eased inflation and rate hike pressures, supporting the metal. Technically, gold faces strong resistance at $4,400; a volume-backed breakout above this level could target $4,510 and $4,700. Conversely, immediate downside support rests at $4,345, with failure risking a decline toward the $4,230–$4,200 range.

TradingKey - As of the Asian session on September 21, gold prices (XAUUSD) maintained high-level consolidation intraday today following a strong rebound last week, with the latest price trading around $4,360. Previously, gold prices fell to a low near $4,235 after the Federal Reserve's rate hike before staging a continuous rebound, climbing at one point last Friday to a one-week high and approaching $4,400.
Fed Remains Hawkish, But Falling Oil Prices Ease Pressure for Further Rate Hikes
From a fundamentals perspective, expectations for Federal Reserve rate hikes remain the primary driver of gold price trends in the near term. Minneapolis Fed President Neel Kashkari said over the weekend that U.S. inflation remains too high across multiple sectors of the economy, expressing support for the Fed's prior rate hike to 3.75%-4.00%. Earlier, Fed Chair Warsh also emphasized that inflation remains above target, prompting the market to continue pricing in the possibility of further rate hikes in the coming months. Higher interest rates and U.S. Treasury yields continue to exert pressure on non-yielding gold.
However, expectations of negotiations between the U.S. and Iran have recently emerged. Over the weekend, Iran set out conditions for resuming talks, and U.S. President Trump also expressed willingness to engage with Iranian President Pezeshkian, boosting market expectations for diplomatic progress. On Monday, WTI crude (USOIL) briefly fell to $94, while Brent crude (UKOIL) dropped to around $101.71, both declining by over 1.5%. As crude oil prices fell, market concerns that energy costs would continue to drive up CPI and PCE eased, reducing pressure on the Fed to rapidly raise rates further and providing some support for gold prices.
Overall, hawkish comments from Fed officials continue to cap gold's upside, but expectations of U.S.-Iran negotiations are driving oil prices lower, easing pressure from inflation and subsequent rate hikes, thus supporting gold. If oil prices continue to retreat and U.S. Treasury yields decline accordingly, conditions for gold to break back above $4,400 will further improve.
Gold Price Technical Analysis
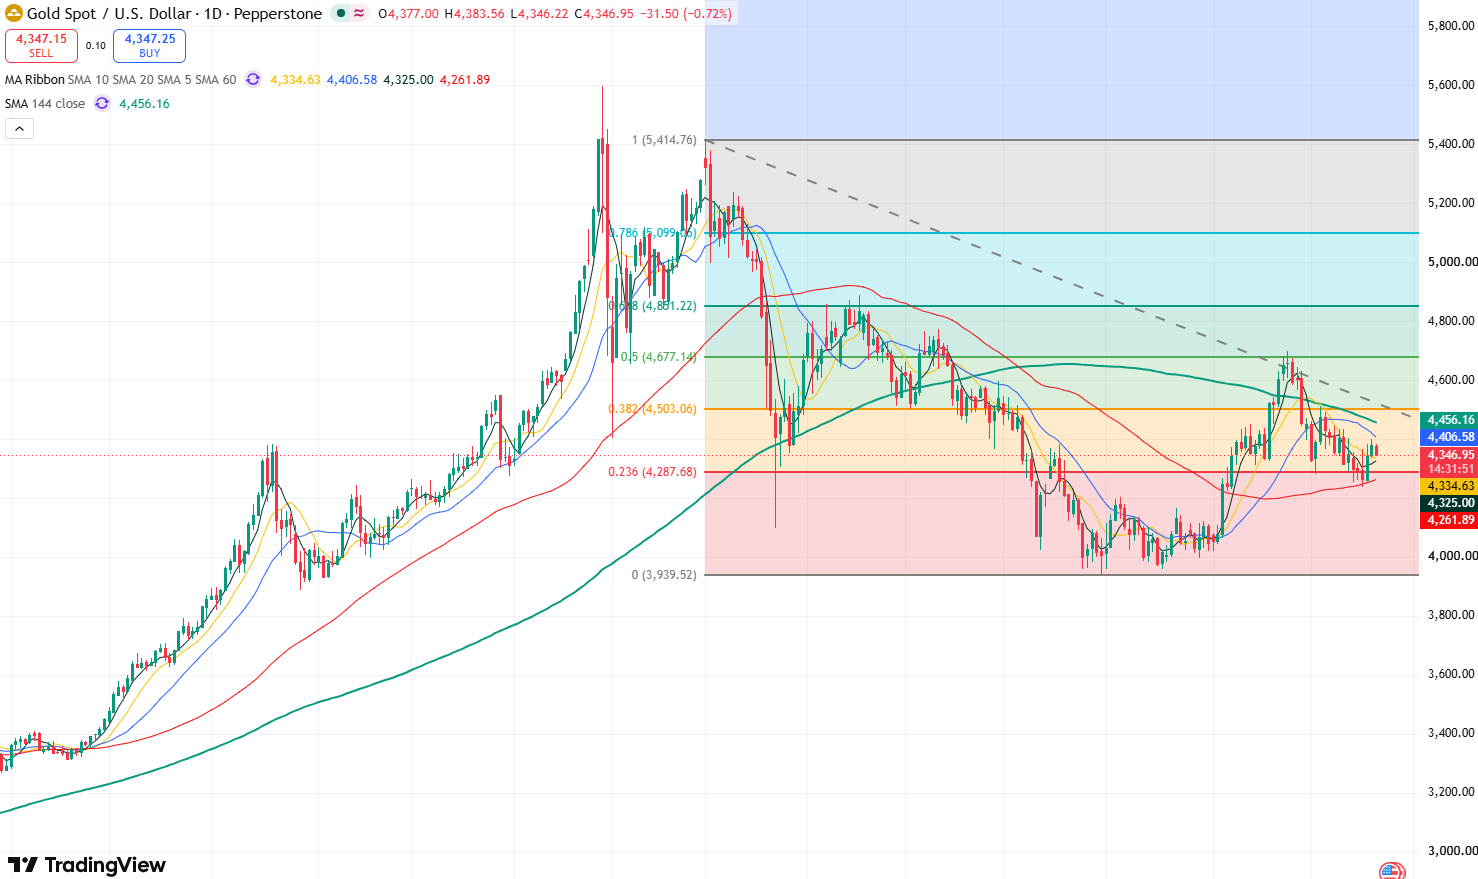
Gold price daily chart, Source: TradingView
Looking at the daily chart for gold prices, last week gold dropped to as low as $4,235 under the bearish weight of the Federal Reserve's rate hike, before embarking on a strong two-day rally to reach $4,399.75. However, it pulled back under pressure below the $4,400 mark, demonstrating strong resistance at this level.
At present, for gold prices to unlock upside potential, a strong breakout with heavy volume and a firm hold above the $4,400 mark is required to open the path toward $4,510. A further breakthrough above $4,510 would open up room for an advance toward the key resistance level of $4,700.
On the downside, gold prices are currently weakening under pressure below $4,400. In the short term, the primary support to watch on the downside is $4,345. If this level is breached, gold prices may fall back toward the $4,300 mark, and if this level fails to hold, prices could continue downward to test the $4,230–$4,200 range.
This content was translated using AI and reviewed for clarity. It is for informational purposes only.
Recommended Articles










Comments (0)
Click the $ button, enter the symbol, and select to link a stock, ETF, or other ticker.